Run a Bollinger Bands Bot with 1% Risk Controls for Crypto Builders
A Bollinger Bands bot can serve as the core of an automated crypto trading approach, provided it includes regime awareness and structured risk controls. Without those two guardrails, band-touch signals alone tend to fail when price trends strongly rather than ranges. The practical path forward involves choosing a strategy family (mean reversion or breakout), coding precise entry and exit rules, backtesting with realistic assumptions, and paper trading before any live deployment.
TL;DR:
- Use mean reversion when ADX is below 25; above that threshold, or when BandWidth nears recent lows, prepare breakout logic.
- Require a mean reversion entry to close below the lower band, with %B below zero and RSI(14) below 30; target the middle band.
- Risk a fixed share of equity per trade, commonly 1%, cap open positions at three to five, and halt entries at a set drawdown limit.
- Test with separate data or rolling windows, include fees, slippage, and realistic fills, then paper trade through ranging and trending markets.
- Disable withdrawal permissions on trading API keys, use two factor authentication, and verify live positions against exchange records after partial fills or connection failures.
Bollinger Bands Fundamentals and Standard Settings
A Bollinger Bands indicator consists of three lines plotted around price: a middle band, which is a simple moving average, and two outer bands set a chosen multiple of standard deviation above and below it. The standard default is a 20-period SMA with bands at plus or minus 2 standard deviations, a configuration most charting platforms load automatically.
This default was not arbitrary, and many traders adjust it for different timeframes or volatility profiles. Shorter-period variants, such as a 10-period SMA with a multiplier closer to 1.9, react faster to price changes and suit intraday or scalping setups. Longer-period variants, such as a 50-period SMA with a multiplier near 2.1, smooth out noise and fit swing or daily timeframes better, according to the same parameter guidance.
Two derived measures extend the base indicator’s usefulness for bot logic:
- %B expresses where price sits relative to the bands on a normalized scale, which lets a bot compare readings across different assets or timeframes without recalculating raw band distances.
- BandWidth measures the distance between the upper and lower bands, a proxy for volatility that bots use to detect when a market is compressing (low BandWidth, often preceding a breakout) or expanding.
John Bollinger himself cautions that the bands provide a relative definition of price highs and lows, not independent buy or sell signals. That distinction shapes every design decision that follows: a touch of the upper or lower band tells a bot where price stands relative to recent volatility, nothing more.
Crypto markets complicate parameter selection further. Volatility in digital assets fluctuates more sharply across sessions than in many traditional markets, so a fixed 20-period, 2-standard-deviation setting that works on a four-hour chart may generate excessive false signals on a one-minute chart during a volatility spike. Bots built for crypto often recalculate BandWidth continuously and adjust position sizing or pause trading when volatility moves outside a defined range, rather than relying on one static parameter set across all conditions.

Strategy Types: Mean Reversion vs Trend-Following With Bollinger Bands
Bollinger Bands support two structurally different strategy families, and conflating them is a common source of poor bot performance.
- Mean reversion treats a touch or close beyond an outer band as a stretched condition likely to snap back toward the middle band. A basic rule sketch: enter long when price closes below the lower band and %B drops under 0, then exit at the middle band or on a time-based stop. This family performs best in ranging, low-trend conditions and tends to produce frequent, smaller wins punctuated by occasional sharp losses when a range breaks.
- Trend-following and breakout approaches treat a sustained push beyond a band, particularly after a BandWidth squeeze, as confirmation of a new directional move. A common entry pattern waits for price to pull back toward the middle band after a breakout, then re-enter in the breakout direction once momentum confirms. This family sacrifices win rate for larger average wins during sustained trends.
- Regime detection separates these two families programmatically. A bot can use ADX readings above a threshold (commonly 25) to flag trending conditions favoring breakout logic, and ADX below that threshold to favor mean reversion. ATR and BandWidth thresholds add a volatility dimension: a BandWidth reading near multi-period lows often precedes an expansion, which a bot can treat as a signal to switch from range logic to breakout logic.
Bollinger’s own explanation of the indicator reinforces that matching the strategy to the prevailing regime, rather than applying one fixed rule set regardless of market behavior, is what separates a workable system from one that degrades during trending periods when price “walks the band” and produces a string of false mean-reversion signals.
Designing a Bollinger Bands Bot: Signal Definition, Filters, Sizing and Exits
Converting a strategy sketch into bot logic requires precise, testable conditions rather than general descriptions. A workable long entry for a mean-reversion configuration might read: close price below the lower band, %B under 0, and RSI(14) under 30 for confirmation. The RSI filter reduces false entries during the early stage of a trend reversal, where price can sit below the lower band for several consecutive candles.
Filters narrow the conditions under which a signal fires at all:
- An ADX threshold (commonly 20 to 25) excludes mean-reversion entries during strongly trending conditions.
- A minimum BandWidth value excludes entries during unusually flat, low-volatility periods where any breakout signal is likely noise.
- An ATR multiplier sets stop distance proportional to current volatility rather than a fixed price or percentage, which keeps risk consistent as volatility shifts.
Position sizing determines how much a single signal can cost the portfolio. A common approach risks a fixed percentage of account equity per trade, often 1%, calculated from entry price to stop price; our risk checklist on the 1-2% rule covers this calculation in more detail. Capping maximum concurrent open positions, for example at three to five across a portfolio, prevents correlated crypto assets from compounding risk during a single market move.
Exit logic needs the same precision as entry logic:
- A middle-band target closes mean-reversion trades once price reverts to the SMA.
- An ATR-based stop sets a hard loss limit proportional to volatility at entry.
- A time-based stop closes a position after a defined number of candles if neither the target nor the stop has triggered, which prevents capital from sitting in a stale, non-performing trade.
- A portfolio-level circuit breaker halts new entries after a defined daily or weekly drawdown threshold, a safeguard our risk management guide for trading bots treats as a baseline control rather than an optional extra.
Pro Tip: Test the exit logic independently of the entry logic. A strong entry signal paired with a poorly tuned exit can still produce a losing system.
Operational details matter as much as the signal math. Bots need a warm-up period of at least 20 to 30 candles before the first signal can be trusted, since a 20-period SMA has no valid reading until 20 candles of data exist. Order type selection (market versus limit) affects execution cost directly: limit orders reduce slippage but risk missed fills during fast moves, a trade-off that should be decided deliberately rather than defaulted.

Backtesting, Paper Trading and Validating a Bollinger Bands Bot
A backtest that ignores trading costs produces numbers that have little connection to live results. Validating a Bollinger Bands bot properly involves several sequential steps.
- Split data into in-sample and out-of-sample periods, or use walk-forward (rolling-window) testing, so the parameters are never tuned on the same data used to judge performance.
- Include realistic fees and slippage in every simulated trade. Backtesting guidance for crypto bots emphasizes that taker and maker fees, slippage models, and realistic order execution are necessary to avoid overly optimistic results, since a backtest that fills every order at the exact signal price is not a backtest of anything tradable.
- Run paper trading across multiple market regimes before committing live capital, long enough to capture at least one ranging period and one trending period, since a strategy that only saw one type of market in testing has not been meaningfully validated.
- Track trade-level statistics, not just aggregate return: Sharpe ratio, maximum drawdown, expectancy per trade, and the distribution of individual trade outcomes all reveal different failure modes that a single headline return figure hides.
One of the clearest sourced findings in this area is that including taker and maker fees, slippage models, and realistic order execution materially changes backtest outcomes compared with frictionless simulations, which means any Bollinger Bands backtest that omits these inputs should be treated as a rough upper bound, not an expected result.
Implementation Details and Common Pitfalls for Live Deployment
Moving from a validated backtest to live execution introduces operational risks that no amount of strategy tuning solves on its own.
- API key permissions should be scoped to trading only, with withdrawal permissions disabled, so that a compromised key cannot move funds out of the exchange account.
- Data hygiene matters: candles must be time-aligned across the feed used for signals and the feed used for execution, missing or partial candles need explicit handling rather than silent skips, and all timestamps should be normalized to a single timezone.
- Order handling needs retry and timeout policies for partial fills, along with reconciliation logic that confirms the bot’s recorded position matches the exchange’s actual position after every trade.
- Alerting should flag any mismatch between expected and actual state immediately rather than at the next scheduled check.
Open-source implementations illustrate common configurations: a Bollinger Bands bot built for Binance combines a 20-period band with RSI(14) for momentum confirmation and ATR-based stops, using a warm-up period of roughly 20 candles before trading begins. The same project notes that robust order-syncing between REST and WebSocket feeds, along with idempotent retry logic, prevents duplicate orders when a connection drops mid-request.
Pro Tip: Log every signal the bot evaluates, including ones it declines to act on. Reviewing declined signals is often the fastest way to catch a filter that is too strict or too loose.
The most frequent pitfall remains relying on raw band touches without any trend or volatility filter, which performs acceptably in backtests dominated by ranging data and then degrades sharply the first time a live market trends persistently.
Risk, Compliance and Security: Regulatory Cautions and Scam Red Flags
Automated trading tied to AI branding has drawn specific regulatory attention. The SEC’s 2026 enforcement actions describe fraud schemes involving hype around AI trading bots to solicit investors, with promises of guaranteed returns and high-pressure sales tactics as recurring features. Investor that crypto trading platforms often lack the custody and counterparty protections of regulated exchanges, which means losses from platform insolvency or mismanagement carry fewer recovery options than losses in a regulated brokerage account.
Practical red flags worth screening for before using any automated trading service:
- Guaranteed or fixed-percentage returns advertised regardless of market conditions.
- High-pressure urgency around deposit deadlines or limited-time access.
- No verifiable registration where registration would normally apply to the service being offered.
A basic security checklist reduces exposure regardless of which bot or strategy is in use: restrict API keys to trading-only scopes, enable two-factor authentication on both the exchange and the bot platform, start with a small initial allocation before scaling up, and review withdrawal controls on the exchange account itself. Our overview of crypto bot automation risks walks through these operational and strategy risks in more depth. Where a strategy involves complex automated decision-making, reviewing a provider’s transparent backtest and paper trading records offers a more reliable signal than marketing claims alone.
Darkbot’s Perspective: Where Bollinger Bands Bots Belong in an Automation Program
A Bollinger Bands bot works best as one component of a structured, regime-aware automation program rather than a standalone system left to run unattended. Parameters that fit current volatility can drift out of alignment as market conditions shift, which makes periodic revalidation, not a one-time backtest, the real determinant of long-term reliability. We treat this as a process question: continuous monitoring, explicit risk limits, and configurable rules matter more than any single indicator setting, and no backtest or paper trading record should be read as a forecast of future results.
— Grisha
How Darkbot Supports Building, Testing and Running Bollinger Bands Bots
We built our platform around the same process discipline this guide describes: define rules, test them honestly, then deploy with controls in place. The platform supports that workflow directly.
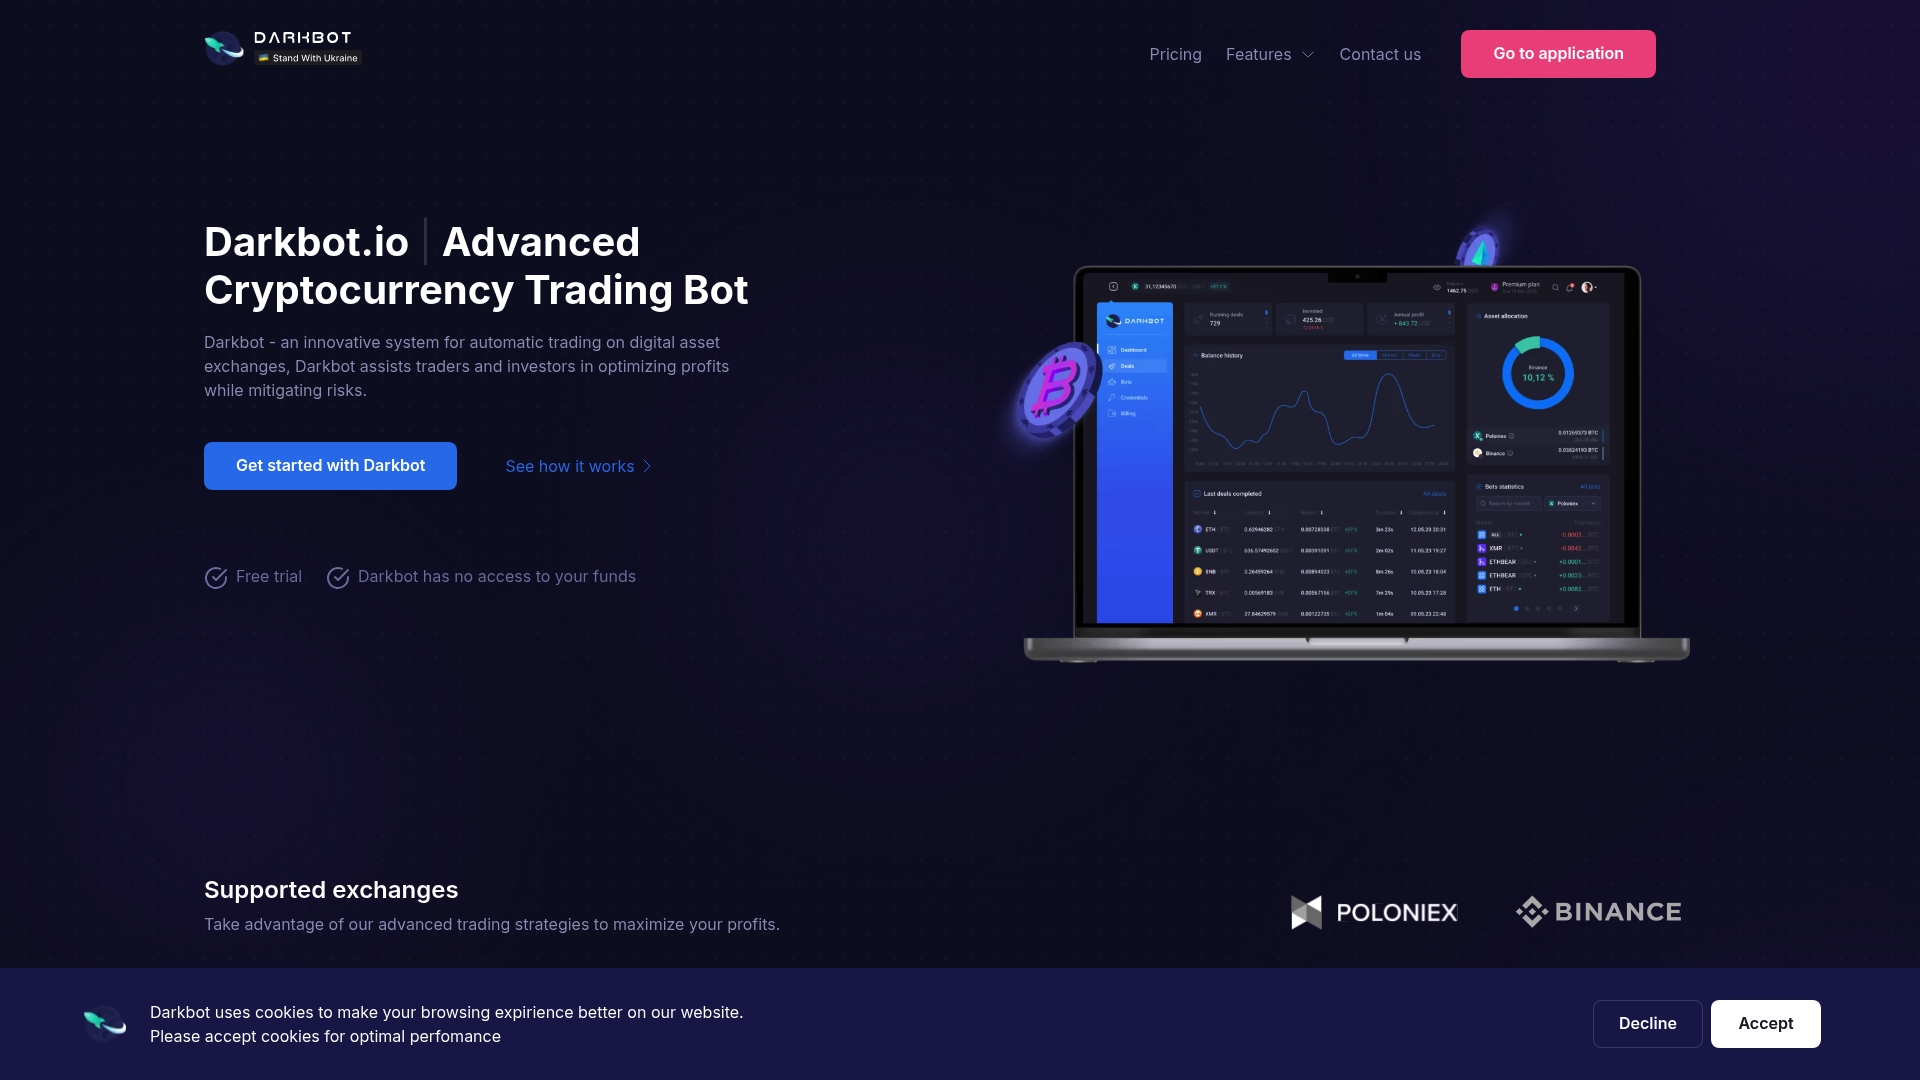
- Customizable strategy rules let us encode Bollinger Bands entries, filters, and exits as explicit, testable logic rather than discretionary judgment calls.
- A backtest engine and paper trading mode let us validate a configuration against historical and live data before any capital is at risk.
- Multi-exchange API integration connects a bot to major exchanges using trading-scoped keys.
- Configurable stop-loss and position sizing rules apply the risk controls this guide covers at the account level, not just inside a single strategy.
A reasonable first step is creating a test bot, running it in paper mode across a few market regimes, and enabling stop-loss rules before any live allocation. Plan details, including the Free, Standard, and Premium tiers, are listed on our pricing page.
This article is general information, not a substitute for advice from a qualified financial advisor. Consult a qualified financial professional about your own circumstances before acting on anything here.
FAQ
What is the Bollinger Bands strategy?
A Bollinger Bands strategy uses the distance between price and the upper, lower, or middle band to time entries and exits. The two dominant versions are mean reversion, which trades a return toward the middle band after a touch of an outer band, and trend-following, which treats a sustained breakout beyond a band as a signal to follow the new direction.
What is the best setting for Bollinger Bands for day trading?
There is no single best setting, since the right configuration depends on timeframe and volatility. The standard default remains a 20-period SMA with bands at plus or minus 2 standard deviations, though many day traders shorten the period and adjust the multiplier slightly to react faster on lower timeframes.
How do I use Bollinger Bands for beginners?
Start by watching how price interacts with the three bands across different market conditions before coding any rules: note whether price respects the middle band in ranges or pushes through the outer bands during trends. Bollinger’s own guidance stresses that a band touch alone is not a signal, so pairing band position with a trend or momentum filter is a reasonable starting point.
What is the Bollinger Bands mean reversion strategy and how does it work?
The mean reversion strategy assumes that a price move beyond an outer band is a temporary extreme likely to pull back toward the middle band average. A bot typically enters when price closes beyond a band and a momentum filter like RSI confirms an extreme reading, then exits near the middle band or after a defined time limit, a pattern that performs best in ranging rather than trending markets.
How do I backtest a Bollinger Bands trading bot properly?
A sound backtest separates the data used to tune parameters from the data used to judge results, commonly through out-of-sample or walk-forward testing. It should also include realistic fees, slippage, and execution assumptions, since omitting trading costs tends to overstate performance compared with live results.
Sources
- Bollinger Bands rules — PineConnector
- SEC press release — enforcement actions and investor warning (2026)
- Bollinger Bands — Official explanation by John Bollinger
- Investor
Recommended

Start trading on Darkbot with ease
Come and explore our crypto trading platform by connecting your free account!
Free plan available • No credit card required