Breakout Strategy for Crypto: 1.5x Volume, ATR Stops, Bot-Ready

The strongest breakout approach for crypto combines three filters: volume confirmation, alignment with the higher-timeframe trend, and strict per-trade risk sizing. Most breakout attempts fail. Studies of chart patterns put failure rates as high, which is exactly why position sizing matters more than pattern selection. Backtest the setup, forward-test it on paper, then consider automation to enforce the rules without hesitation.
TL;DR:
- Volume confirmation with at least 1.5 times the 20-period average is crucial to filter out false breakouts, especially on lower timeframe charts.
- Breakouts during European and US session overlaps tend to be more reliable, while weekend or overnight moves carry a higher risk of fakeouts.
- Using daily or four-hour chart breakouts on major assets like Bitcoin and Ethereum generally offers more stability than lower timeframes or smaller cap altcoins.
- Ensuring the breakout candle’s volume exceeds recent averages and confirming a full candle close reduces the likelihood of entering false signals.
- Position sizing should limit risk to 0.25%–2% of capital, with stops placed below structural levels plus ATR buffers to avoid premature exits.
What Is a Breakout Strategy in Crypto, and Why Does It Work Differently Here?
A breakout occurs when price decisively clears a defined support or resistance level, and a trader positions to ride the momentum that typically follows. The mechanism is straightforward: price has been trapped in a range because buyers and sellers were roughly balanced at those boundaries. When one side finally overwhelms the other, often with a surge in participation, the liquidity profile and volume expansion become the primary drivers of follow-through. Stops matter here because they define where the thesis is wrong, not just where pain starts.
Crypto breaks from equities and forex in ways that change how you should build a breakout strategy crypto traders can actually rely on. Markets never close. There is no opening bell that resets liquidity, no lunch lull, no weekend gap to fill on Monday. Instead, volume drifts thin during off-peak hours and thickens during session overlaps, and order books on smaller exchanges can be shallow enough that a single large market order pushes price through a level with no real conviction behind it.
Session timing changes signal quality. Breakouts that occur during the European and US session overlap tend to carry more reliable follow-through, while breakouts during weekend or overnight hours show a higher rate of fakeouts because fewer participants are actively defending levels. A break that looks identical on a chart can mean two very different things depending on when it happens.
Asset selection and timeframe need to move together. A few practical anchors:
- Bitcoin and Ethereum breakouts on the 4-hour or daily chart tend to be more stable because deep order books absorb noise better.
- Mid-cap alts often need volume confirmation on top of price action alone, since their books thin out faster under stress.
- Low-cap alts are the riskiest venue for this strategy: a coordinated buy or a single whale order can fake a breakout with no real demand behind it.
- Lower timeframes (5 to 15 minutes) generate far more signals, but a much larger share are noise rather than genuine range expansion.
A rough liquidity rule of thumb is to be cautious if 24-hour volume on the asset is low relative to its market cap, or the breakout candle’s volume does not strongly exceed recent averages. This single filter eliminates a large share of low-quality setups before you ever open a chart pattern.
Common Breakout Patterns and How to Measure Their Targets
Most tradable crypto breakout setups fall into four categories: horizontal range breaks, trendline breaks, chart pattern breaks like triangles and flags, and volatility-contraction squeezes. Each has its own identification rules and its own way of computing a realistic price target, and knowing both before you enter is what separates a plan from a guess.
-
Horizontal range breakouts. Look for at least two to three clear touches on both the support and resistance boundary, with price compressing as it approaches the edges. The measured-move target is the height of the range added to the breakout point. A $2,000 range width breaking above resistance projects a target $2,000 above that resistance line.
-
Trendline breakouts. Valid trendlines need a minimum of three touch points to be considered structurally meaningful, not just a line drawn to fit two candles. Targets are less mechanical here. Traders typically use the prior swing high or low as the first target, then trail the rest.
-
Ascending and descending triangles. These require converging trendlines with at least two touches on each side and progressively tighter price action, a visual signature of compression. The measured move takes the vertical height of the triangle at its widest point and projects it from the breakout level.
-
Symmetrical triangles. Similar compression logic applies, but direction is genuinely uncertain until the break. Wait for the close outside the pattern before assuming direction, since symmetrical triangles resolve in either direction roughly evenly.
-
Bull and bear flags. A flag follows a sharp directional move (the pole) and consolidates in a tight, mildly sloped channel against the trend. The target extends the length of the pole from the breakout point of the flag, which tends to make these among the more mechanically reliable measured moves on crypto charts.
-
Cup-and-handle patterns. Look for a rounded basing structure followed by a smaller pullback (the handle) before the breakout. The target measures the depth of the cup from its rim and projects that distance upward from the breakout point.
-
Bollinger Band and volatility squeezes. When band width compresses to multi-week lows, it signals stored energy rather than direction. Practical playbooks pair base or range structure with momentum confirmation and ATR-based stop placement, including specific setups like Bollinger squeeze expansions and daily high/low breaks confirmed by a VWAP reclaim.
Reliability varies by pattern and by timeframe. Flags and squeeze breakouts on the 1 hour to 4 hour charts tend to resolve faster and cleaner in crypto because they capture short bursts of momentum without waiting on a full session cycle. Triangles and cup-and-handle setups take longer to form and are more prone to getting faked out mid-formation, since the extended compression window gives more opportunities for a false move before the real one. Daily and weekly triangle breakouts, when they do confirm, tend to carry more weight simply because more participants have been watching the same lines.
Entry Methods: Break-and-Close, Retest, and Volume Filters
Three entry styles dominate breakout trading, and all trades speed against reliability differently. Picking one as your default, rather than switching case by case, is what keeps a strategy testable.
Aggressive entries trigger the instant price touches the level, often with a market order. This captures the fastest expansions and the best average entry price on genuine breaks, but it also means eating every fakeout at full size with no confirmation whatsoever.
Break-and-close entries wait for a candle to fully close beyond the level on the chosen timeframe before entering. This filters out wicks that poke through a level and immediately reverse, which is one of the most common ways crypto breakouts fail on lower timeframes.
Retest entries wait for price to break, then pull back to retest the broken level as new support or resistance, and enter on the bounce. This approach generally improves risk to reward and cuts down on false-break losses, though it will miss the fastest, most explosive moves that never look back to offer a retest at all.
Volume is the filter that separates real breaks from noise across all three entry styles. A widely used threshold treats breakout-candle volume at or above 1.5 times the 20-period average as the marker of a genuine move; anything below that deserves real skepticism regardless of how clean the chart pattern looks. Layer a momentum check on top, whether that is MACD crossing into agreement with the breakout direction, a rising Rate of Change, or RSI clearing 50 with room before overbought territory. Keeping the indicator stack lean, structure plus ATR plus one momentum reading, tends to outperform stacking five indicators that mostly repeat the same information.
Session liquidity affects order type as much as timing. During thin overnight hours, limit orders placed slightly beyond the breakout level protect against slippage on a shallow book; during high-liquidity overlap hours, market orders are more defensible because spreads are tighter and fills are more predictable.
Stop placement should sit below the broken structure (the range floor, the trendline, the flag’s lower boundary) with an ATR-based buffer added on top, rather than an arbitrary percentage. A tight stop that ignores structure gets clipped by normal volatility; a stop with no ATR buffer at all gets clipped by the exact kind of wick a break-and-close filter was designed to ignore.
- Aggressive entry: fastest fill, zero confirmation, highest fakeout exposure.
- Break-and-close: filters most wick fakeouts, sacrifices some entry price.
- Retest: best risk to reward on average, misses fast expansions entirely.
- Volume threshold: 1.5x the 20-period average as a working minimum.
- Momentum check: MACD, ROC, or RSI, one is usually enough.
Pro Tip: Backtest your chosen entry style against at least one alternative before committing to it as a default. A retest bias that looks safer on paper can quietly cut your total trade count in half, which changes the statistical reliability of every other number in your backtest.
Position Sizing, Stops, and Trade Management for Breakout Trades
Breakout trading lives or dies on money management, not pattern recognition. Since a majority of chart-pattern breakouts fail in some form, the entire strategy’s profitability depends on losing small amounts and letting the smaller share of winners run far enough to cover losses.
Per-trade risk is generally advised to be small, adjusted for asset volatility, with lower risk on less liquid, higher-volatility assets and somewhat higher risk on major pairs with tested setups. This is not a stylistic preference. It is the mechanism that keeps a string of failed breakouts, which will happen, from doing lasting damage to the account.
Stops belong at a structurally meaningful point (below the range, below the retested level, below the flag’s lower trendline) with an ATR buffer added so normal volatility does not trigger an exit before the thesis has actually failed. Moving a stop further away after entering because the trade is “just about to work” is one of the most common ways disciplined risk plans quietly fall apart. A documented risk checklist helps here precisely because it removes the moment-to-moment decision from an emotional context.
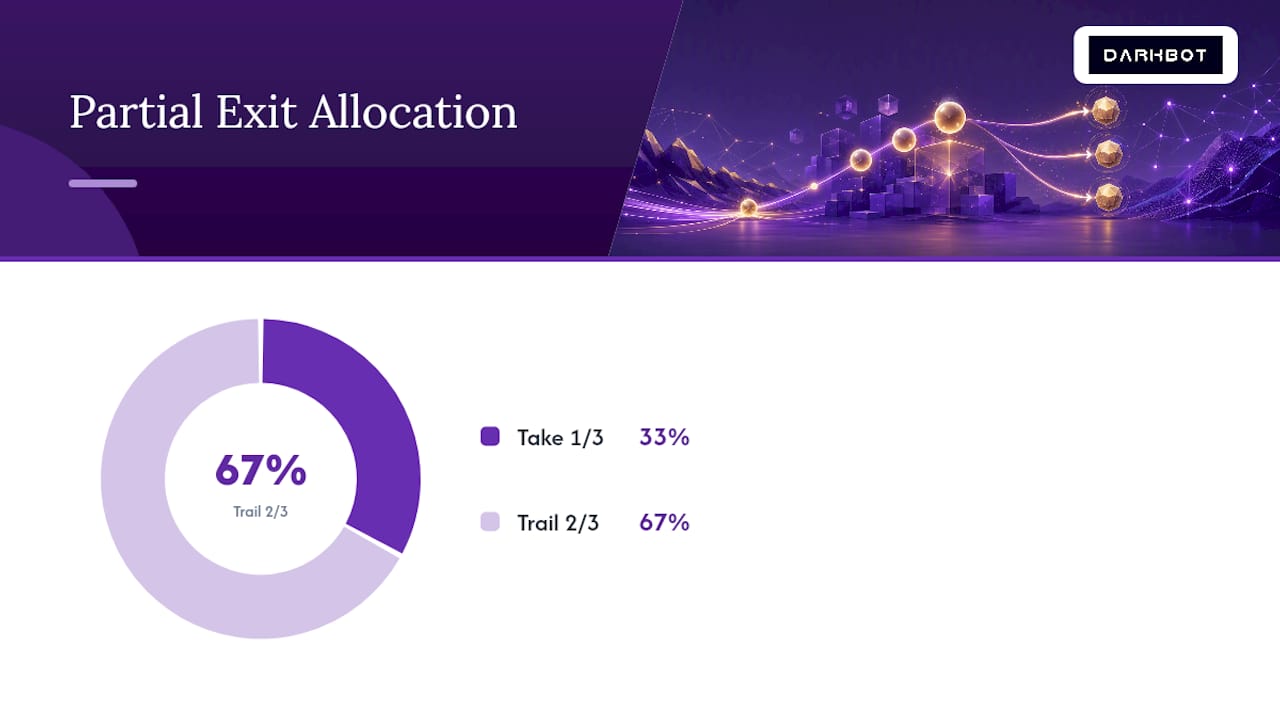
Partial profit-taking locks in progress on a trade that has already proven itself while leaving room for the move to extend. A common structure takes a third of the position off at a 1:1 reward-to-risk ratio, moves the stop to breakeven, and trails the remainder using a structure-based or ATR-based trailing stop rather than a fixed price target.
Perpetual futures introduce a variable spot trading does not: funding rates. A breakout trade held through several funding intervals on a crowded side of the market can bleed a meaningful share of the position’s expected profit to funding payments alone, which is why sizing on perps should account for expected holding time, not just the stop distance. Spot positions avoid funding entirely but tie up full capital rather than leveraged margin, which changes how many concurrent setups a given account can realistically run.
- Risk per trade: 0.25% to 2% of equity, scaled to asset volatility.
- Stop logic: structure level plus ATR buffer, never a round percentage alone.
- Partial exits: take some profit at 1:1, move stop to breakeven, trail the rest.
- Perpetuals: model funding cost into expected trade profitability, not just the stop.
- Never widen a stop after entry to avoid taking a loss.
Backtesting and Forward-Testing a Breakout Playbook Before Going Live
A breakout strategy is only as trustworthy as the test that validated it, and most informal backtests overstate performance because they skip realistic costs. Building a workflow that catches this before capital is at risk takes a handful of concrete steps.
-
Write the rules down as fixed, unambiguous logic. Entry trigger, volume threshold, stop distance, and exit rule all need to be specific enough that two people running the same test would get the same trades. Vague rules produce backtests that flatter the strategy.
-
Model realistic costs. Backtests need slippage, maker and taker fee schedules, and funding costs for any perpetual position built in from the start, not added as an afterthought. A strategy that looks profitable with zero friction can turn negative once real exchange costs are applied.
-
Test across multiple market regimes. Run the same rule set through a strong trending period, a choppy range-bound stretch, and at least one sharp drawdown period. A breakout strategy tuned only on a bull run will misfire badly the first time the market chops sideways.
-
Keep parameter grids small. Testing a handful of stop and volume-threshold variations is reasonable; testing hundreds invites curve-fitting a strategy to historical noise rather than finding something durable.
-
Validate out-of-sample. Hold back a portion of historical data the optimization never touched, then check that performance holds up on that untouched segment before trusting the numbers.
-
Forward-test on paper for several weeks minimum. Track win rate, average R per trade, and maximum drawdown in real time before any live capital is committed, since paper results under live market conditions often diverge from backtest assumptions.
-
Scale automation gradually. Move from manual alerts, to semi-automated execution where a human confirms each signal, to full automation only once the paper-tested numbers hold steady across that transition. A staged rollout catches implementation gaps that a spreadsheet backtest cannot.
Turning Breakout Rules Into an Automated, Rule-Based System
Automation exists to enforce a plan exactly as written, not to improve on it. The value of a rule-based system for breakout trading crypto strategies comes from consistency: a bot checks the volume threshold, the timeframe alignment, and the stop distance identically on trade one and trade one thousand, without the fatigue or second-guessing that creeps into manual execution during a losing streak. Execution speed also matters mechanically, since a breakout that needs a break-and-close confirmation can move meaningfully in the seconds between a candle closing and a human placing an order, and that gap is exactly what automated execution removes.
Before letting any bot manage real capital, run through a short safety checklist:
- Paper-test the exact rule set the bot will run, not a simplified version of it.
- Build in circuit breakers, a maximum daily loss in R, that halt trading automatically rather than relying on a trader to notice and intervene.
- Check funding rates on perpetual positions before opening, since a bot with no funding awareness can quietly erode returns on a crowded trade.
- Confirm exchange API permissions are scoped to trading only, with withdrawal access disabled, as a basic security practice.
- Run one strategy per bot instance where feasible, rather than one bot juggling multiple unrelated logic sets.
Darkbot is built around this exact workflow: exchange integration through API keys, backtesting and paper trading before any live sizing, and support for running multiple bots simultaneously so a breakout strategy can be isolated from other logic rather than tangled into one system. Strategy fine-tuning tools let a trader adjust thresholds like volume multiples or ATR buffers without rewriting code, which keeps the rule set auditable at every stage from backtest to live execution.
When Breakout Trading Works, and When to Walk Away From It
Breakout strategies earn their keep in markets with clear directional conviction, coming off a genuine compression period, on assets liquid enough that the volume filter actually means something. Bitcoin and Ethereum during a session overlap, after a multi-day range has tightened, is where this setup does its best work. Thin, illiquid alt pairs during a quiet weekend are where it does its worst.
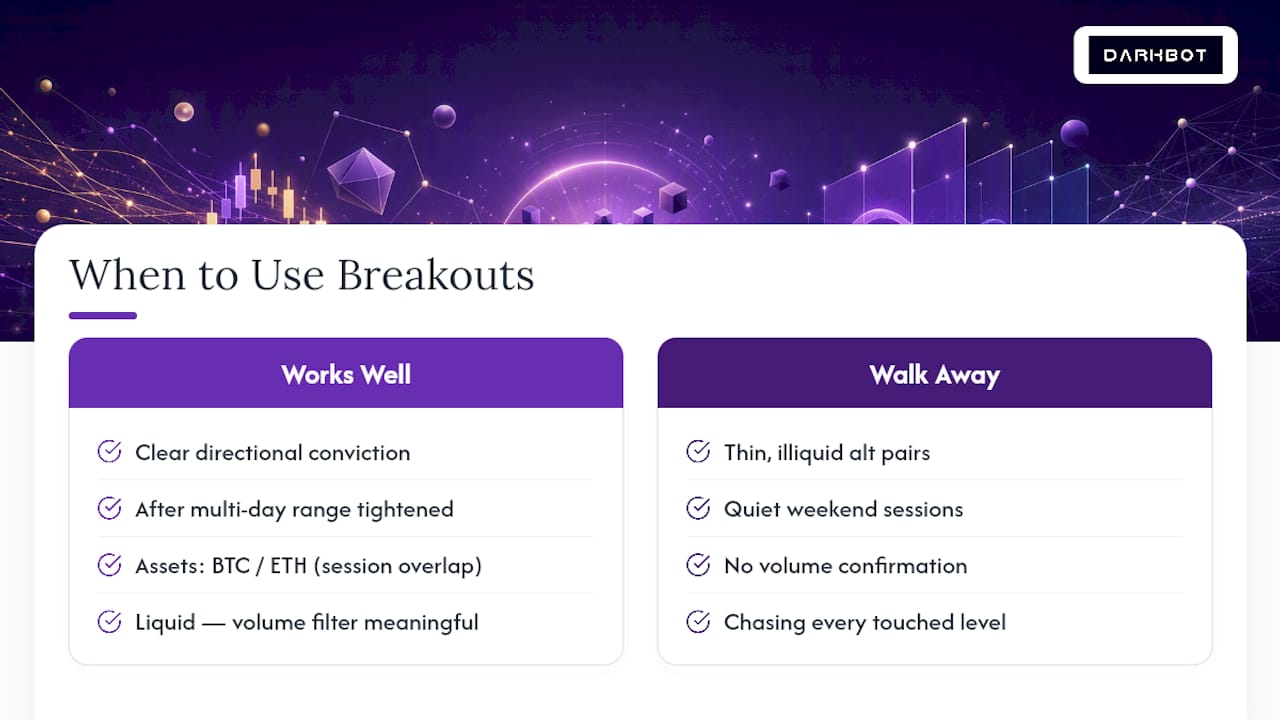
The mistake I see most often isn’t a bad pattern read. It is chasing every level that gets touched, without checking whether volume or session timing actually supports the move. That’s discipline fatigue, not analysis failure, and it’s precisely the kind of error a rule-based system is designed to remove: a bot does not get impatient watching a range for three days.
Stay honest about the failure rate. Judge the system by R-multiples over a large enough sample, not by any single trade.
— Grisha
Test Your Breakout Playbook on Darkbot Before Committing Live Capital
Every rule covered here, the volume threshold, the timeframe alignment, the ATR-based stop, only has value if it gets tested consistently rather than applied inconsistently by hand. That is the specific gap Darkbot is built to close: a way to encode a breakout playbook once and run it identically across every signal, instead of re-deciding the same filters under pressure each time a level gets touched.

The platform connects to major exchanges through API keys, lets you backtest and paper-trade a strategy before any capital is at risk, and supports running multiple bots at once so a breakout system stays separate from other strategies rather than competing for the same logic. Risk controls, including per-trade sizing rules and stop discipline, sit underneath the strategy layer so execution stays consistent with the plan on paper. Start by paper-testing the exact rules outlined in this article on Darkbot, and only move toward live sizing once the paper results hold up over a meaningful sample.
Sources
- Crypto Breakout Strategy: How to Trade Profitably
- How To Trade Breakouts In Crypto Markets (Techniques + Indicators, 24/7 Ready) - Indicators 101
- Breakout Trading Crypto Guide: Entries, Fakeout Filters & Measured Moves | DennTech
This article is general information, not a substitute for advice from a qualified financial advisor. Consult a qualified financial professional about your own circumstances before acting on anything here.
FAQ
Is a Breakout Strategy Profitable in Crypto?
It can be, but only when combined with strict risk sizing, since a large share of individual breakouts fail even when the overall system produces a positive expectancy over many trades.
Which Breakout Strategy Is Best for Crypto Markets?
Volume-confirmed breakouts aligned with the higher-timeframe trend, entered on a break-and-close or retest rather than aggressively, tend to hold up best against fakeouts across most crypto assets.
Can I Make $100 a Day From Crypto Breakout Trading?
Daily profit targets are not a reliable way to judge a breakout strategy, since results vary trade to trade; consistency should be measured in win rate and R-multiple over dozens of trades, not a daily dollar figure.
What Is the Most Profitable Crypto Trading Strategy?
No single strategy is universally most profitable, since results depend heavily on market conditions, asset selection, and execution discipline; a well-tested, volume-confirmed breakout system with strict sizing is one of the more reliable approaches for trending markets.
How Do I Avoid Fakeouts When Trading Crypto Breakouts?
Require breakout-candle volume at or above 1.5 times the 20-period average, wait for a full candle close beyond the level, and avoid trading breakouts during thin overnight or weekend sessions.
Recommended

Start trading on Darkbot with ease
Come and explore our crypto trading platform by connecting your free account!
Free plan available • No credit card required