5 Step Crypto Trading Analytics for Execution Grade Automation

Crypto trading analytics combines on-chain data, spot and derivatives metrics, and pre-built charts to reveal structural liquidity shifts and participant behavior before they show up in price. The practical outcome is better timing, tighter risk control, and cleaner execution. Signals like exchange reserve changes, funding rates, and whale wallet flows do most of the heavy lifting for traders who want to act on structure instead of emotion.
TL;DR:
- On-chain, derivatives, liquidity, and behavioral data all need to be combined for a complete market picture, especially for institutional trading workflows.
- Data delivery must match execution speed; real-time APIs and tick-level feeds are essential for high-frequency strategies, while hourly aggregated data causes delays.
- Validating analytics setups with historical backtesting and win-rate analysis is crucial before live trading, preventing overreliance on opaque or incomplete data sources.
- Automated trading should incorporate regime filters, size limits, and logging, rather than reacting impulsively to single signals or low-resolution data.
- Reacting to isolated signals and neglecting full data context remains the most common mistake among traders, risking unnecessary losses or missed opportunities.
What Does Crypto Trading Analytics Actually Cover?
Crypto trading analytics is not a single dashboard. It is a layered stack of data categories, each answering a different question about market behavior.
On-chain metrics track what happens on the ledger itself: transfer volumes, holder cohort changes, and smart-contract interactions. These reveal how long-term holders, exchanges, and new entrants are actually positioning, independent of what price is doing. Market metrics cover order-book liquidity, volume, funding rates, open interest, and liquidation clusters, which together describe how leveraged the market has become and where forced selling could originate. A third layer, behavioral and sentiment data, adds social volume, exchange inflow and outflow patterns, and smart-money wallet tracking that flags accumulation ahead of price moves.
Platforms that unify on-chain and market data into one view are increasingly treated as standard for institutional-style workflows, since isolated metrics rarely tell the full story on their own, according to CryptoQuant’s on-chain research. A composite chart that overlays exchange reserves against funding rates, for instance, can show whether a rally is backed by spot demand or inflated by leverage.
Core categories traders monitor:
- On-chain flows: exchange reserves, holder cohorts, network activity
- Derivatives data: funding rates, open interest, liquidation levels
- Liquidity metrics: order-book depth, spread, volume distribution
- Behavioral signals: whale wallet activity, social sentiment shifts
APIs, Dashboards, or Raw Feeds: How Should Data Reach You?
Where the data comes from matters as much as what it measures. On-chain sources like node data and blockchain indexers give raw transparency into wallet-level activity, but they require processing before they’re tradable. Exchange feeds are faster and cleaner for price and volume but say nothing about wallet behavior. Aggregated index providers sit in between, blending multiple venues into a single reference price, which reduces noise but adds a layer of trust in how that composite is built.
Delivery format should match the trader’s speed requirement. REST and WebSocket APIs and webhook alerts suit anyone building automated or semi-automated pipelines, while web dashboards remain useful for manual review and pattern recognition. For algorithmic workflows, programmatic APIs and webhooks generally beat manual dashboards because they cut both latency and the risk of operator error, a point echoed in Databricks’ work on crypto data pipelines.
Data delivery checklist:
- Confirm whether feeds are block/tick-level or aggregated over minutes
- Check for webhook or alert support if you plan to automate responses
- Verify how composite prices are calculated across venues
- Look for audit trails that let you reconcile data after the fact
Pro Tip: If your strategy reacts within seconds, aggregated hourly data will consistently lag the market you’re trying to trade. Match your data resolution to your execution speed, not the other way around.
Institutional-grade vendors emphasize granular feeds and composite pricing drawn from hundreds of venues specifically because single-exchange data can misrepresent true market conditions, per Kaiko’s market data documentation. Even a few seconds of delay can distort execution-sensitive strategies, since block and tick-resolution data let systematic traders cross-reference on-chain events against price volatility in near real time, according to CryptoQuant.
How Do Traders Turn Analytics Into Actual Trades?
Analytics only earn their keep when they change a decision. Most disciplined traders run a repeatable sequence rather than reacting to a single indicator.
- Check the macro backdrop first. Events like CPI prints interact directly with crypto positioning, and analytics help interpret whether a move reflects genuine repricing or short-term noise around a data release, as detailed in CoinShares’ market update.
- Read the regime signal. A daily risk-on or risk-off indicator derived from on-chain data can gate whether a strategy trades at all, keeping activity tied to structure rather than impulse, a method Glassnode documents in its market intelligence work.
- Layer in whale and flow monitoring. Set filters around wallet size and transaction frequency to separate genuine accumulation from noise; distribution into exchanges tends to precede selling pressure, while withdrawal into cold storage often signals conviction.
- Screen derivatives risk. Rising funding rates paired with climbing open interest and clustered liquidation levels are execution cautions, not entry signals on their own.
- Connect alerts to execution with guardrails. Whether the pipeline is manual or automated, log every trigger and outcome for post-trade review.
Combining on-chain accumulation data with derivatives positioning is what separates genuine demand from short-covering or a levered squeeze, since either can produce an identical-looking candle. A workflow reviewing macro context, regime status, and flow data in sequence, before sizing a trade, catches most of the false signals that pure price action misses.
What Should You Check Before Committing to an Analytics Stack?
Picking a workflow comes down to matching data quality and delivery speed to your actual trading style, not chasing the most feature-dense dashboard.
Run through this checklist before committing:
- Data coverage: does it include on-chain, spot, and derivatives, or just one?
- Latency: is resolution block-level, tick-level, or aggregated over time?
- API robustness: are webhooks and programmatic access available?
- Dashboarding and export: can you pull raw data for your own review?
- Backtesting support: can setups be checked against historical occurrence and win-rate data before going live?
Validating a setup against historical occurrence scans and win-rate statistics before execution is standard institutional practice, and it applies just as well to a smaller trading operation, according to TailoredMarketData’s research on trade validation.
| Trading scale | Essential features | Common red flag |
|---|---|---|
| Casual / part-time | Basic dashboard, price and volume alerts | No export or audit trail |
| Active retail | On-chain + derivatives feeds, webhook alerts | Opaque composite pricing |
| Systematic / algorithmic | Tick-level API, backtesting, execution logging | No backtesting or historical validation |
Opaque composite calculations, missing audit logs, and the absence of backtesting are the three clearest signs a provider is optimized for marketing rather than execution.
Mapping Analytics to Guarded Automation
Analytics become actionable once signals convert into rules with limits attached, rather than open-ended discretion. A regime reading can gate whether a strategy is allowed to trade at all. A funding-rate spike can trigger a size cap instead of a full stop. This is the core logic behind automated trading systems built around rule-driven adaptation rather than prediction.

A defensible rollout follows a fixed sequence: backtest against historical data, move to paper trading, then scale into live execution gradually while every input and output gets logged for review. Skipping straight to live capital removes the feedback loop that catches a flawed rule before it costs money, a structure explored further in machine learning approaches to strategy optimization.
Points worth building into any guarded automation setup:
- Regime gating tied to on-chain and derivatives signals, not price alone
- Position size caps that scale down as leverage indicators rise
- Multiple bots running independent, uncorrelated rule sets
- Exchange API integration with logging at every execution step
Common Analytics Mistakes and What Discipline Actually Looks Like
The recurring mistake isn’t lack of data. It’s reacting to a single signal, especially low-resolution data, as if it were a fast-moving one, and ignoring execution cost until the fill confirms the trade was worse than the chart suggested. Traders who treat crypto like a traditional asset class also tend to under-use the transparency blockchain data actually offers, missing edges like whale tracking and regime detection entirely.
Disciplined habits look almost boring by comparison: confirm with multiple orthogonal signals, gate activity by regime, let automation enforce size limits instead of willpower, and review every trade after the fact instead of only the ones that lost money.
— Grisha
Put Your Analytics to Work Without Manual Execution
Reading the signals is only half the job. The harder part is executing them the same way every time, without hesitation on the good setups or overreach on the bad ones. A platform is designed to turn regime, flow, and derivatives checks into rule-based automation, with API integration across digital asset exchanges, customizable strategy logic, and backtesting before live capital deployment.
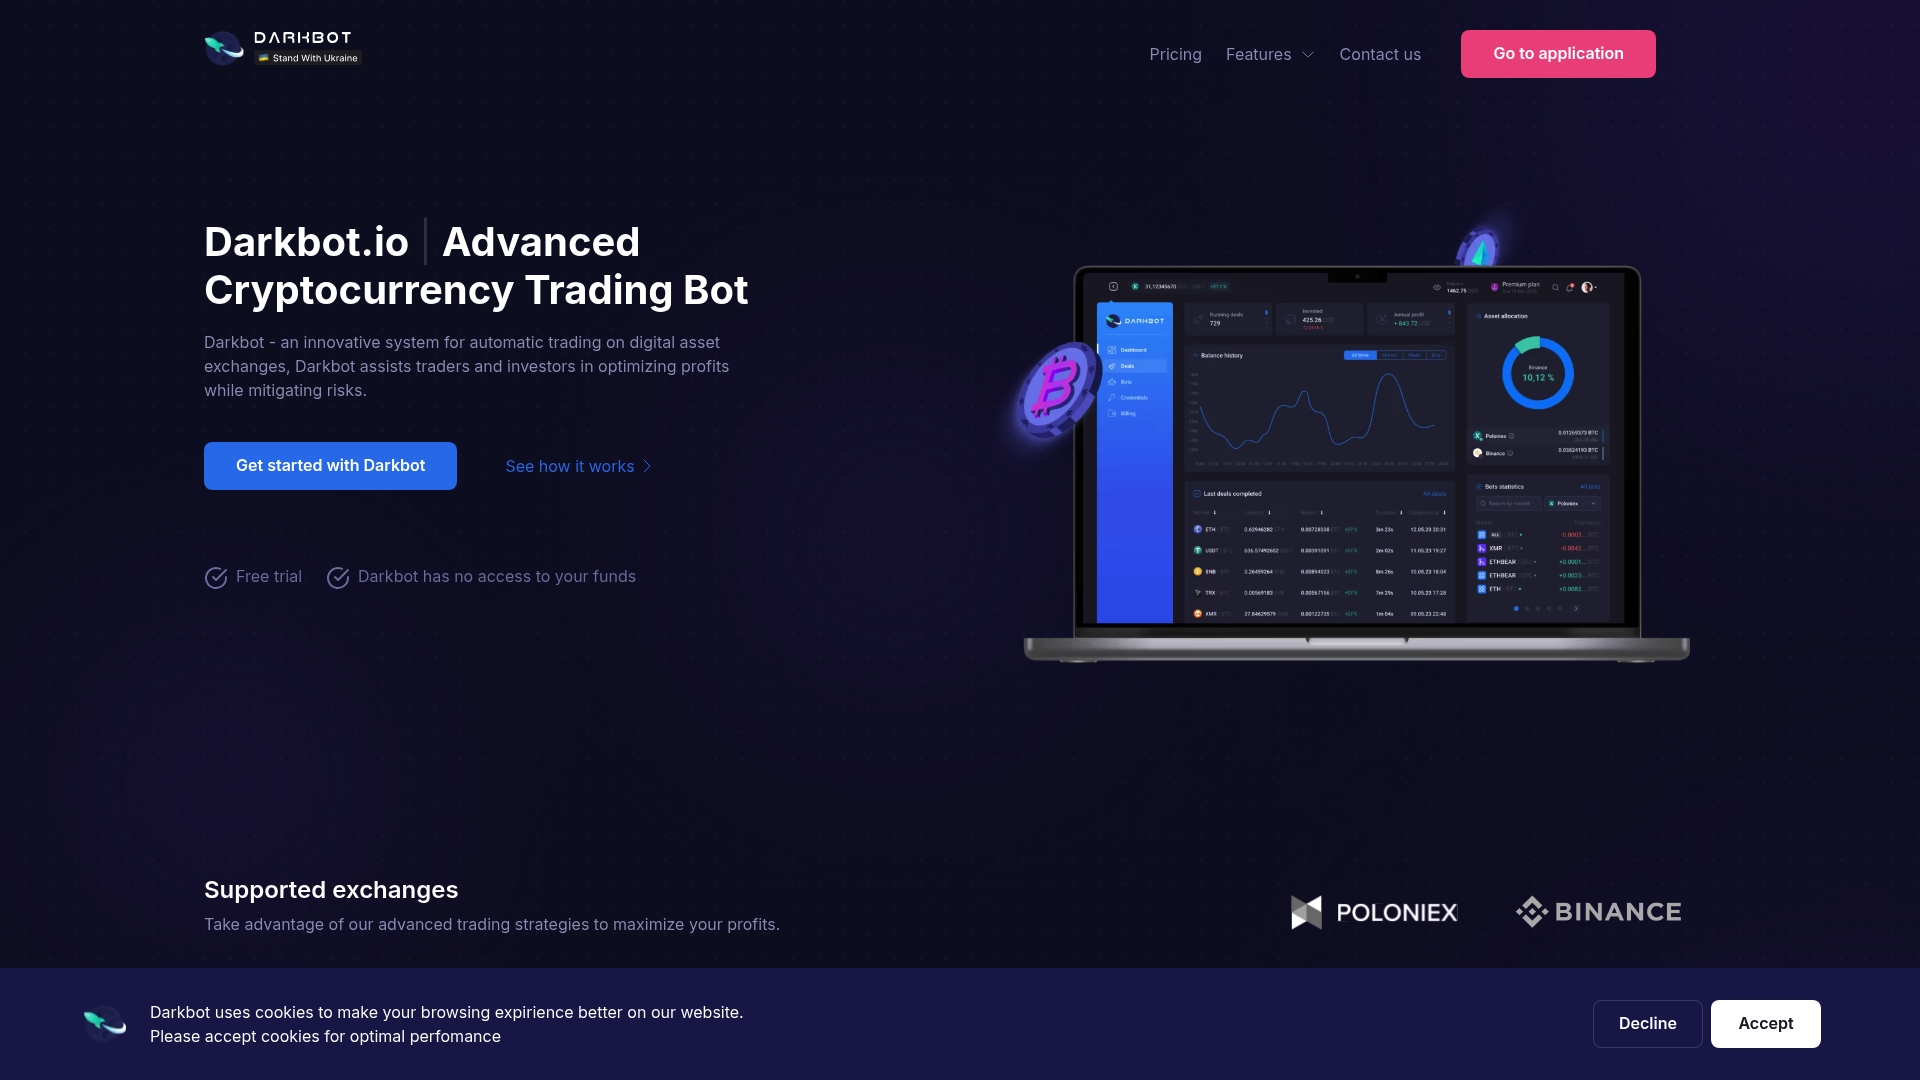
The practical next step is to paper-test a signal-driven rule set before scaling it, using the same staged rollout, backtest, paper trade, then guarded live execution, that disciplined systematic trading depends on. You can review risk management fundamentals for derivatives exposure alongside the setup process, then start configuring a strategy directly on the Darkbot platform to see how your analytics translate into structured, repeatable execution.
Sources
- CoinShares Market Update
- Crypto Data Analysis (Databricks)
- Market Intelligence Workspace for Faster Trading Research | TailoredMarketData
FAQ
Which Analysis Method Is Best for Crypto Trading?
No single method covers everything; combining on-chain flow data, derivatives positioning, and liquidity metrics catches structural shifts that price charts alone miss, particularly around regime changes.
Can I Make $100 a Day From Crypto Trading?
Daily returns depend entirely on capital, volatility, and risk tolerance, and no analytics platform or automation tool can guarantee a fixed daily outcome; consistent process and risk control enable traders to manage risk without promising specific returns.
Can the IRS See Your Crypto Wallet?
Exchanges operating in the United States generally report user transaction data to tax authorities, and on-chain activity is publicly visible on most blockchains, so wallet activity is far from anonymous.
What if I Had Put $1,000 Into Bitcoin Five Years Ago?
The outcome would depend entirely on the exact entry and exit dates, since Bitcoin’s price history includes both major rallies and sharp drawdowns within any five-year window; past performance in one period says nothing about future results.
Does Darkbot Analyze On-Chain and Derivatives Data Directly?
Darkbot focuses on automating execution of rule-based strategies using exchange API integration, real-time analytics, and backtesting, letting traders convert their own analytics signals into guarded, systematic automation.
Recommended

Start trading on Darkbot with ease
Come and explore our crypto trading platform by connecting your free account!
Free plan available • No credit card required