3 Volatility Filter Patterns That Cut Bad Trades for Crypto Bots

A volatility filter is a regime gate, not a trading signal. It measures how much an asset is moving and blocks or allows existing entries based on that reading, rather than generating buy or sell decisions itself. For most automated crypto strategies, the practical starting point is an EWMA-based standard deviation of returns with a short span, or an ATR reading, paired with a rolling quantile threshold. Expect the immediate effect to be fewer trades and a higher average quality per trade taken.
TL;DR:
- Most effective volatility filters in crypto trading use EWMA or ATR measures to balance responsiveness and computational efficiency.
- Thresholds should be recalibrated periodically using rolling quantiles to adapt to changing market volatility.
- Filters mainly reduce trade frequency by blocking setups during high or low volatility regimes, which can improve trade quality.
- Proper integration treats the filter as a gate around signals, ensuring safety controls like stop-losses remain unaffected.
- Consistent backtesting with realistic costs and walk-forward analysis helps validate that the filter improves strategy performance.
What Does a Volatility Filter Actually Do in Crypto Trading?
A volatility filter sits between your signal generator and your order execution logic. It doesn’t decide direction. It decides whether current market conditions are sane enough for your existing strategy to act on its own signals. That distinction gets lost constantly among newer bot builders who treat volatility readings as buy/sell triggers on their own.
Which strategies benefit depends heavily on their underlying logic:
- Momentum and breakout strategies often want to trade into rising volatility, so the gate should permit entries once volatility crosses above a floor, not below a ceiling.
- Mean-reversion strategies do the opposite. High volatility usually invalidates the assumption that price snaps back to a mean, so the gate should block entries when volatility spikes.
- Grid and rebalancing strategies sit in the middle. They tolerate moderate volatility but suffer badly in trending, high-volatility regimes that blow through grid levels.
Filters reduce trade frequency almost by design, since they remove a slice of setups that would have otherwise triggered. That’s usually the point. Where filtering hurts is in very low-latency scalping systems, where the edge comes from acting on noise itself. Adding a smoothing filter there can delay entries past the point where the edge existed.
Common Volatility Measures and Their Live-Trading Pros and Cons
Five measures show up repeatedly in production crypto systems, and each carries a different trade-off between responsiveness and computational cost.
- Rolling standard deviation — simple, interpretable, but recomputing a full window on every candle wastes compute and lags sharp regime shifts.
- ATR (Average True Range) — accounts for gaps and wicks, not just close-to-close moves, which matters on exchanges with thin order books.
- EWMA (exponentially weighted moving average) of squared returns — weights recent data more heavily and updates incrementally, making it the default choice for live bots.
- Z-score of returns — useful for flagging outlier moves relative to recent history, often layered on top of EWMA rather than used alone.
- Realized volatility indices — aggregate high-frequency data into a single measure, valuable for research but heavier to compute than most bots need in real time.
Backtest note: practitioner writeups on volatility-filtered momentum strategies report an example Sharpe ratio around 1.2 after gating trades by a volatility threshold, alongside a meaningful drop in trade count. The gain comes from removing low-quality setups, not from finding new ones.
Academic work adds a layer worth knowing even if you never run it live. A comparative study across GARCH, EGARCH, IGARCH, GJR-GARCH, and HAR models found that HAR performs best at short forecasting horizons while EGARCH does better at medium horizons, and no single model wins across every cryptocurrency and timeframe. That’s a strong argument for keeping your live filter simple and reserving HAR/GARCH-style modeling for offline research or nightly recalibration jobs, where the computational cost doesn’t bottleneck execution.
For most timeframes from 1 minute to 4 hours, EWMA or ATR gives the best balance of responsiveness and cost. On daily or weekly bars, a rolling std or blended HAR-style measure is worth the extra overhead since recalculation happens far less often.
How to Build a Volatility Filter: Code Patterns and Adaptive Thresholds
Three implementation patterns cover almost every production use case.
- Rolling std with z-score gating. Compute returns, take a rolling window (commonly 20 to 50 periods), and calculate the z-score of the current return against that window’s mean and standard deviation. Gate trades when the z-score exceeds a set bound, typically ±2.
- EWMA of squared returns. Update a single running variance estimate each candle using a decay factor derived from the chosen span (a span of 20 to 30 periods is a reasonable default for hourly crypto data). This avoids recomputing a full window and updates in constant time.
- ATR-style true range. Calculate true range per candle (the greatest of high minus low, high minus previous close, or low minus previous close), then smooth it with an EWMA or simple moving average to get a stable volatility proxy that respects gaps.
A minimal EWMA update looks like this in Python:
alpha = 2 / (span + 1)
ewma_var = alpha * (return_t ** 2) + (1 - alpha) * ewma_var
ewma_std = ewma_var ** 0.5
Adaptive thresholds recalibrate the metric choice itself. Instead of a fixed cutoff, use a rolling quantile: compute the 70th or 80th percentile of the volatility measure over the trailing 100 to 200 periods, and gate trades against that moving bar rather than a static number. This keeps the filter relevant as baseline volatility drifts over weeks, which developer implementations of live volatility filters consistently recommend over hardcoded thresholds.

A few production details separate a working filter from a fragile one: compute EWMA and ATR incrementally per candle rather than recalculating over a full array each tick, since that keeps memory and CPU use flat regardless of history length. Handle NaN values explicitly during the warmup period before your window fills, and confirm that timestamps across your candle feed and order execution engine share the same alignment. A one-candle offset between your volatility reading and your entry logic quietly corrupts every backtest result downstream.
Pro Tip: Log your volatility metric alongside every trade decision, not just the final gate/no-gate outcome. When you review performance later, you need to see the actual reading that triggered (or blocked) each trade, not just a pass/fail flag.
Integrating the Filter With Signals, Sizing, and Execution
The cleanest pattern treats the filter as a gate wrapped around your existing signal logic, not a replacement for it. Your strategy still generates buy and sell signals exactly as before; the filter simply decides whether the bot is allowed to act on them right now.
- Multi-timeframe confirmation works well here: use a higher timeframe (say, 4 hour) volatility reading as the regime gate, and a lower timeframe (5 or 15 minute) signal for entry timing within that regime.
- Position sizing should scale inversely with volatility. A common heuristic divides target risk by current ATR, so a wider ATR shrinks position size and a tighter one allows more exposure for the same dollar risk.
- Execution safety matters as much as the filter logic itself. Never let a volatility filter override or disable your existing stop-loss or max-drawdown controls when it trips. The filter should reduce trading activity, not remove your safety net.
External tools like live volatility ranking screeners can complement an in-bot filter by helping you spot which symbols are worth watching, but they shouldn’t replace the gate computed inside your own execution logic, where timing and data alignment actually matter.
Pro Tip: If your bot trades multiple pairs, calibrate volatility thresholds per asset rather than using one global cutoff. Bitcoin’s baseline volatility and a low-cap altcoin’s baseline volatility are not the same distribution, and forcing one threshold across both usually over-filters one and under-filters the other.
Backtesting and Evaluation: What to Measure
Evaluating a volatility filter means comparing strategy performance with and without the gate, holding every other parameter constant.
- Track the full metric set: Sharpe ratio, trade frequency, average trade profit and loss, maximum drawdown, and hit rate. A filter that raises Sharpe while cutting trade count in half is usually working as intended; one that raises Sharpe by accident of a smaller sample size is not.
- Run a controlled before/after comparison. Change only the filter’s presence and threshold, nothing else in the strategy, so any performance shift is attributable to the filter itself.
- Use walk-forward testing. Fit thresholds on one period and test on the next, rolling forward, rather than optimizing thresholds on the same data you evaluate against.
- Include realistic frictions: slippage, exchange fees, and execution latency. A filter that looks good on frictionless backtests can lose its edge once real costs are applied to a lower trade count.
Volatility regimes don’t resolve quickly. GARCH fits on Bitcoin show volatility shocks with a half-life around 48 trading days, meaning a spike in volatility can take weeks to fully decay. Build your evaluation windows long enough to capture at least one full regime cycle, or your Sharpe comparison risks measuring a single transient event rather than genuine filter performance.
Common Mistakes and Tuning Heuristics for Live Systems
Over-filtering shows up as a bot that goes quiet for days at a time and misses obviously tradable moves. Under-filtering shows up as a strategy that still gets whipsawed during clear high-volatility spikes, meaning the threshold was set too loose or the metric too slow to react.
- Blend a fast metric (EWMA) with a slower, more stable one (rolling std or a HAR-style measure) rather than relying on a single indicator, since no single volatility model dominates across every asset and horizon.
- Recalibrate thresholds on a fixed schedule, weekly is a reasonable default, and monitor for sustained shifts in the baseline rather than reacting to single-day spikes.
- Watch for operational bugs that masquerade as filter problems: timezone mismatches between data feeds, inconsistent candle aggregation across exchanges, and NaN values silently propagating into z-score calculations.
Pro Tip: If your filter’s gate rate swings wildly week to week without a corresponding change in market conditions, suspect a data pipeline bug before you suspect the threshold itself.
Who Wrote This and How Darkbot Applies These Filters
This guide was written by Grisha, drawing on quantitative trading practice and the academic and practitioner research cited throughout. Darkbot applies the same principles operationally:
- EWMA and ATR-based gating built into strategy templates for incremental, low-latency volatility readings.
- Sandbox backtesting and paper trading environments for testing filter thresholds before live deployment.
- Further implementation guidance available on the Darkbot blog covering strategy optimization in depth.
What the Research Actually Supports (and What It Doesn’t)
The conventional advice on volatility filtering tends to oversell precision. Traders read about GARCH and HAR models and assume more sophisticated math produces better live results. The research doesn’t support that. The HAR/GARCH comparison study found no single model dominates across assets and horizons, which is really a vote for simplicity in production, not complexity. A well-tuned EWMA filter, updated incrementally and recalibrated on a fixed schedule, will outperform a poorly maintained GARCH model every time in a live system.
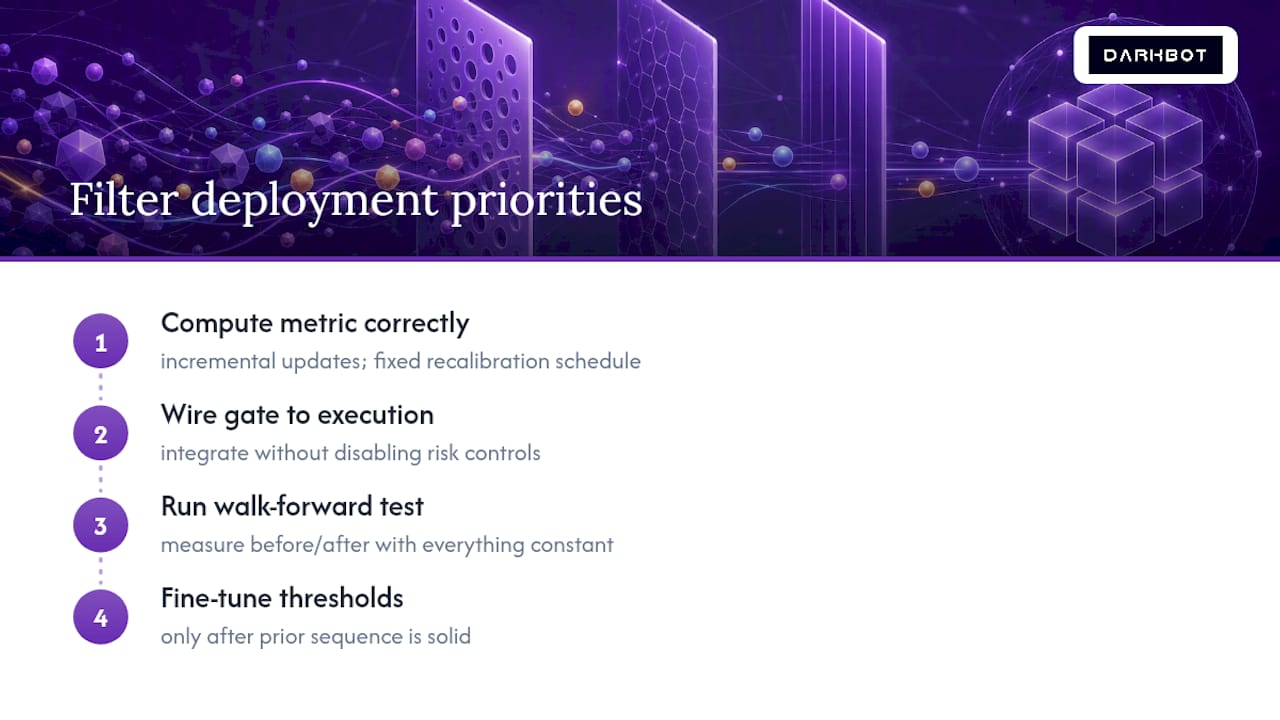
What’s underrated is the discipline of measuring before and after with everything else held constant. Most bot builders change three parameters at once when they add a filter, then can’t tell which change caused the improvement. What’s overrated is threshold precision. Spending a week optimizing a quantile cutoff from 75% to 78% rarely matters as much as making sure your filter reacts to genuine regime change rather than a single noisy candle.
Prioritize this in order: get the metric computing correctly and incrementally, get the gate wired into execution without disabling your risk controls, then run a proper walk-forward test. Only after that sequence is solid does threshold fine-tuning earn its time.
— Grisha
Test a Volatility-Gated Bot in Sandbox Mode
This platform is designed for systematic, rule-driven execution as described above. Users can configure a volatility-gated strategy, backtest it against historical data, and run it in paper trading before committing capital.
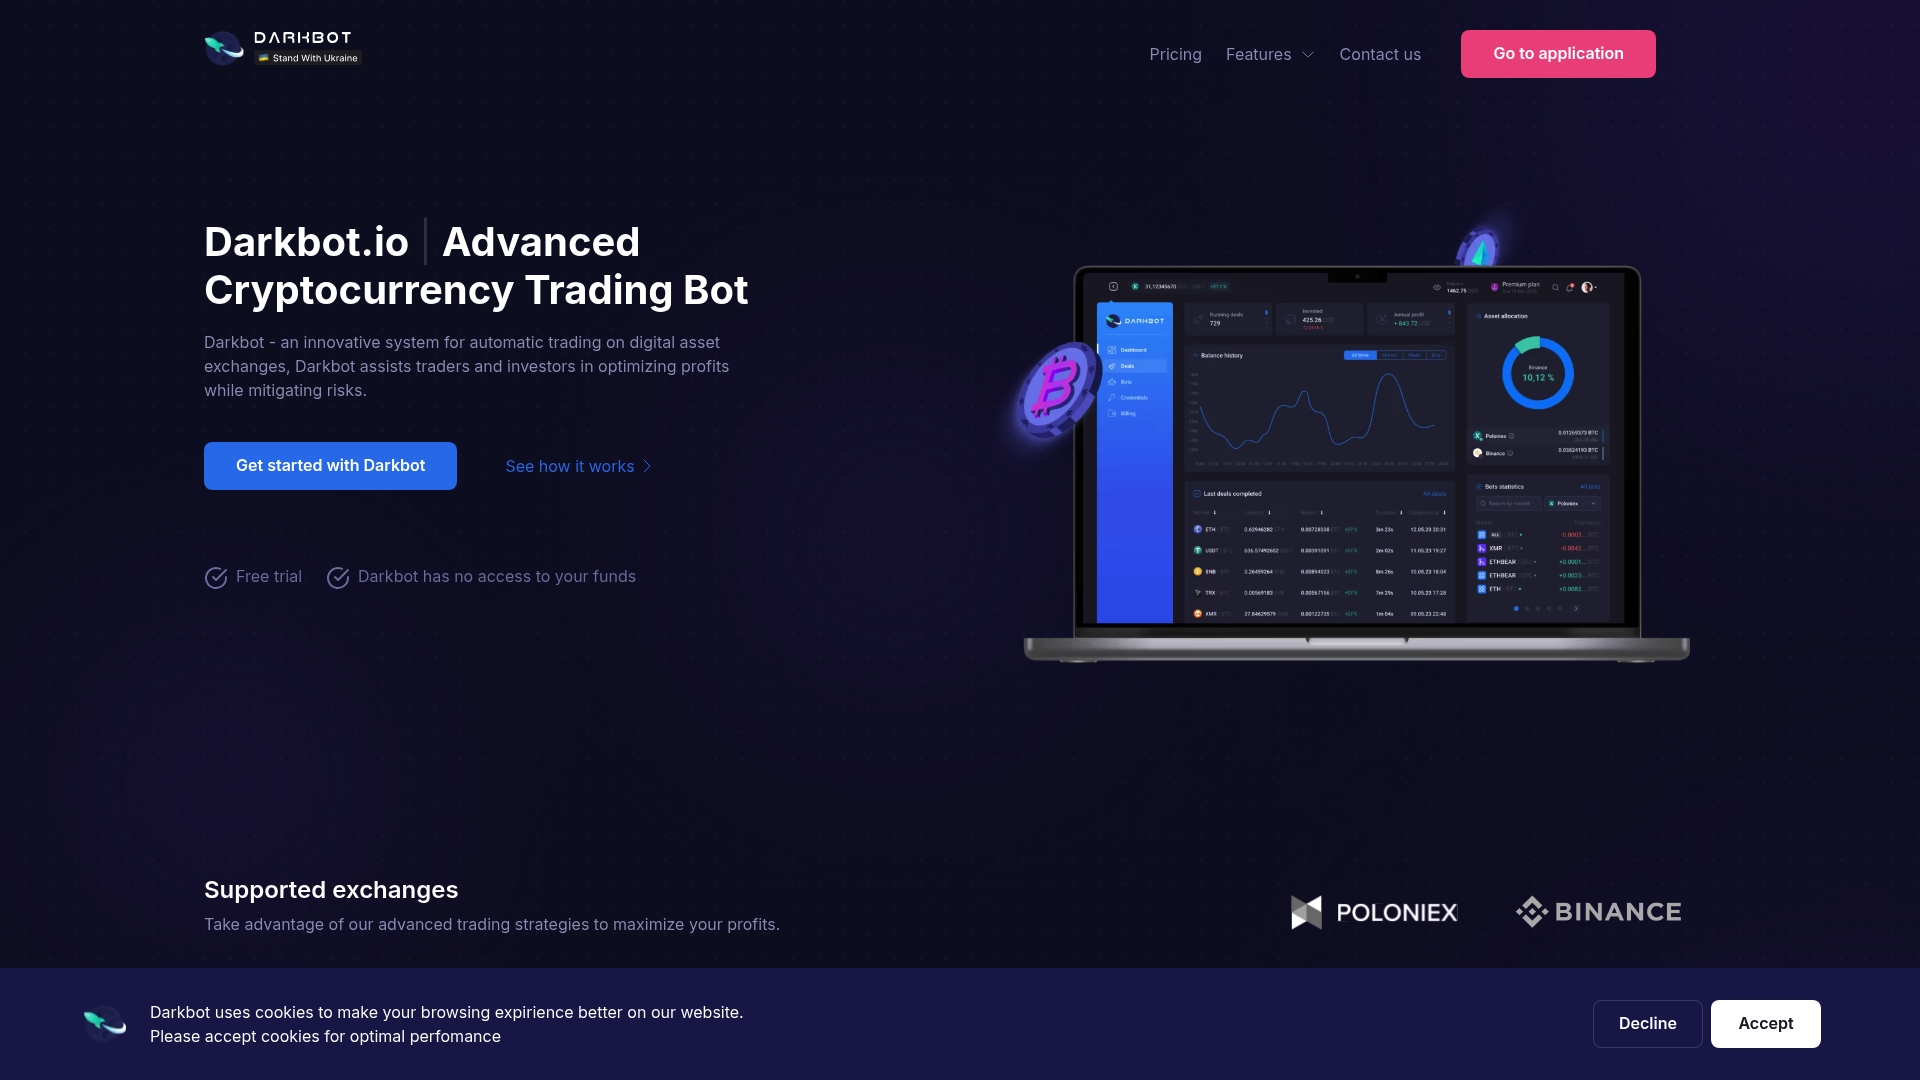
The platform supports custom indicators, multiple simultaneous bots, and sandbox backtesting, all useful for testing EWMA or ATR-based gating logic before it touches a live exchange balance. That matters because a filter that looks solid on paper can behave differently once real execution latency and fees enter the picture, and the only way to know is to test it under realistic conditions first. If you want to see how a volatility filter performs against your own strategy assumptions, start by setting up a bot at Darkbot and running it through paper trading before any live deployment.
Sources
For deeper technical grounding, the MDPI comparative study on GARCH, EGARCH, and HAR models covers model performance across cryptocurrencies and horizons. The V-Lab BTC GARCH analytics page offers live empirical volatility fits, and the Dev.to walkthrough on Python volatility filters provides working code for a live bot implementation.
This article is general information, not a substitute for advice from a qualified financial advisor. Consult a qualified financial professional about your own circumstances before acting on anything here.
- Predicting the Volatility of Cryptocurrencies’ Returns Using High-Frequency Data: A Comparative Analysis of GARCH, EGARCH, IGARCH, GJR-GARCH, LRE, and HAR Models (MDPI)
- V-Lab: Bitcoin to US Dollar GARCH Volatility Analysis
- Systematic Crypto Trading Strategies: Momentum, Mean Reversion & Volatility Filtering (Medium)
FAQ
What Is the 1% Rule in Crypto Trading?
The 1% rule caps the capital risked on any single trade at 1% of total portfolio value, a position-sizing discipline separate from volatility filtering but often used alongside ATR-based sizing to adjust for current market conditions.
Is 20% Volatility High for Crypto?
It depends on the timeframe and asset.
What Is the Best Indicator for Measuring Crypto Volatility?
No single indicator wins universally. EWMA and ATR are the most practical for live bots due to their incremental computation, while HAR and EGARCH models perform better in research contexts depending on the forecasting horizon.
What Drives Crypto Market Volatility?
Crypto volatility stems from factors including thinner order books than traditional markets, clustering and long-memory effects in returns, regulatory news, and shocks that can persist for weeks once triggered.
Can Darkbot Apply a Volatility Filter to My Trading Strategy?
Darkbot supports custom indicators and strategy templates that can incorporate EWMA or ATR-based volatility gating, along with backtesting and paper trading to evaluate the filter before live deployment.
Recommended

Start trading on Darkbot with ease
Come and explore our crypto trading platform by connecting your free account!
Free plan available • No credit card required