Data Analysis in Cryptocurrency: A Trader's 2026 Guide

TL;DR:
- Cryptocurrency analysis integrates market, on-chain, and sentiment data to guide investment decisions and improve risk-adjusted returns. Combining multiple data sources with structured regime detection and automation enhances trading discipline and minimizes emotional errors. Effective strategy execution relies on predefined frameworks, not just data access, ensuring systematic, reliable decision-making.
Data analysis in cryptocurrency is the systematic examination of market, on-chain, and sentiment data to guide investment and trading decisions toward stronger risk-adjusted returns. Where traditional markets offer decades of structured data, crypto markets demand a broader toolkit: price feeds, blockchain transaction records, social sentiment scores, and liquidity metrics all feed into a coherent analytical picture. Traders who treat these inputs as separate signals miss the compounding value of reading them together. This guide explains the core data categories, the analytical methods that extract signal from noise, and the frameworks that translate raw data into disciplined trading decisions.
What types of data are essential for cryptocurrency analysis?
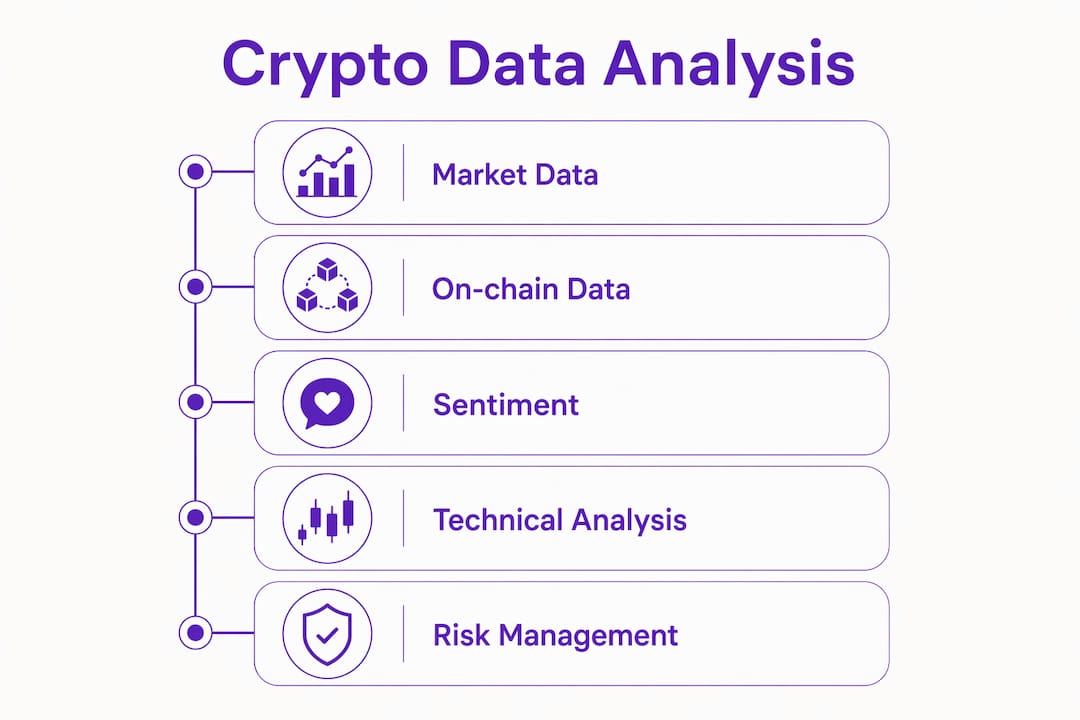
Cryptocurrency data analysis draws from three distinct categories, each capturing a different dimension of market behavior. Understanding what each category measures, and where it falls short, determines how reliably you can act on it.
Market data is the most accessible layer. It includes price (open, high, low, close), trading volume, order book depth, and bid-ask spreads. OHLC data forms the foundation for most technical indicators, while order book data reveals real-time supply and demand imbalances. Order sizes above $100K show net selling during retail spikes, which means bid-ask ratios and market depth metrics are critical for distinguishing institutional accumulation from retail-driven price moves.

On-chain blockchain data goes deeper than price. It tracks wallet activity, transaction counts, holder distribution, cost basis metrics, and miner behavior directly from the blockchain ledger. Glassnode, Nansen, and Dune Analytics are the primary platforms for this data layer. On-chain signals are particularly useful for identifying structural market phases because they reflect actual capital movement rather than speculative order flow.
Sentiment and news data quantifies the emotional state of the market. Natural language processing tools like VADER and large language models extract sentiment scores from news articles, Reddit threads, X posts, and Telegram channels. The Fear & Greed Index fell to 29 (Fear) in early June 2026, coinciding with a 3.3% weekly contraction in total market capitalization. That reading confirmed what on-chain data was already suggesting: risk-off behavior was spreading across the market.
| Data type | Primary sources | Strength | Limitation |
|---|---|---|---|
| Market data (OHLC, volume) | Binance, Coinbase, CoinGecko | Real-time, high frequency | Susceptible to manipulation |
| On-chain blockchain data | Glassnode, Nansen, Dune Analytics | Reflects actual capital flows | Requires interpretation expertise |
| Sentiment and news data | VADER, LLMs, CryptoCompare | Captures narrative shifts early | High noise, context-dependent |
Each data type has a different latency and reliability profile. Market data updates in milliseconds but can be gamed. On-chain data is slower but harder to fake. Sentiment data is fast but volatile. Combining all three reduces the blind spots that any single source carries.
How do technical and sentiment analysis complement each other?
Technical analysis and sentiment analysis are not competing methods. They answer different questions, and their combination produces more reliable signals than either delivers alone.
Technical indicators measure price behavior and momentum. The most widely used include:
- RSI (Relative Strength Index): Identifies overbought and oversold conditions on a 0 to 100 scale, with readings below 30 or above 70 signaling potential reversals.
- Simple Moving Averages (SMA) and Exponential Moving Averages (EMA): Smooth price data to reveal trend direction. The 50-day and 200-day SMAs are standard reference points for medium and long-term trend assessment.
- Bollinger Bands: Measure volatility by plotting standard deviation bands around a moving average, flagging breakout conditions when price compresses near the bands.
- MACD (Moving Average Convergence Divergence): Tracks momentum shifts by comparing two EMAs, with crossovers used as entry and exit signals.
Sentiment analysis adds a layer that price data cannot capture directly. Tools using VADER or fine-tuned LLMs assign polarity scores to news and social content, producing a quantified measure of market mood. Sentiment metrics improve expected return estimates by quantifying news impact in highly volatile cryptocurrencies, which means they reduce mispricing risk in fast-moving markets where price alone lags the narrative.
The empirical case for combining both is clear. Integrating NLP-extracted sentiment with technical indicators in a mean-variance optimization framework achieves stronger risk-adjusted returns than traditional strategies. The key caveat is that sentiment signals amplify drawdowns during stress periods if left unmanaged. Risk controls must be applied to the combined signal, not just to individual indicators.
Pro Tip: When RSI signals an oversold condition but sentiment scores remain deeply negative, treat the technical signal as tentative. Sentiment reversals often precede price reversals by hours to days in crypto markets, so waiting for sentiment confirmation before entering reduces false-positive trades.
What advanced analysis approaches identify market regimes and opportunities?
Beyond standard indicators, sophisticated traders use regime detection and structural on-chain thresholds to frame every trade within a broader market context. These approaches shift the question from “what is price doing now?” to “what kind of market environment are we operating in?”
Regime detection using rolling volatility classifies market conditions into high, medium, and low volatility phases. The method uses 30-day rolling annualized volatility with percentile thresholds to label each candle by regime. This matters because the same RSI reading carries different implications in a low-volatility accumulation phase versus a high-volatility distribution phase. Applying a single strategy across all regimes is one of the most common and costly errors in systematic crypto trading.
Information transmission delays between large-cap and small-cap assets create measurable trading opportunities. Large caps react immediately to Bitcoin shocks; small caps lag by several minutes. This delay opens short-duration arbitrage and anticipatory repositioning windows for traders who monitor cross-asset correlation in real time.
On-chain structural thresholds provide the most durable reference points for trend assessment. The True Market Mean, a cost-basis metric derived from on-chain transaction data, marks the boundary between profitable and unprofitable average holders. Failure to sustain above the True Market Mean signals weak price rallies likely to reverse. This threshold is particularly useful for distinguishing genuine bull market recoveries from short-lived bounces.
Here is a practical sequence for applying these frameworks:
- Classify the current volatility regime using 30-day rolling percentile thresholds before selecting any strategy.
- Check whether price is above or below the True Market Mean to assess structural trend direction.
- Monitor Bitcoin’s reaction to macro events first, then watch for lagged responses in mid and small-cap assets.
- Cross-reference on-chain cost basis data with macro liquidity trends and ETF flows on a monthly basis to avoid reacting to short-term noise.
Pro Tip: Monthly monitoring of macro and on-chain signals reduces false entries significantly more than daily chart-watching. The discipline to ignore short-term noise is itself an analytical edge.
| Framework | Data source | Primary use |
|---|---|---|
| Rolling volatility regime | Price history (30-day window) | Strategy selection by market phase |
| True Market Mean | Glassnode on-chain cost basis | Structural trend confirmation |
| Cross-asset lag analysis | Multi-exchange order flow | Short-duration arbitrage timing |
How does data analysis improve risk management and portfolio construction?
Risk management in crypto is not simply about setting stop-losses. It is about building a portfolio construction process that accounts for the statistical properties of crypto assets, including fat-tailed return distributions, high cross-asset correlation during stress events, and rapid sentiment-driven drawdowns.
Mean-variance optimization, the framework developed by Harry Markowitz, applies directly to crypto portfolios when enhanced with sentiment signals. Standard mean-variance models use historical returns and covariances to allocate capital across assets. Adding sentiment-derived expected return estimates improves allocation accuracy in volatile markets where historical returns alone understate forward-looking risk. Sentiment signals provide consistent performance gains but require explicit drawdown controls during market stress periods.
Key risk management practices supported by data analysis include:
- Drawdown monitoring: Track rolling maximum drawdown across the portfolio, not just individual positions. Crypto portfolios can lose 40 to 60 percent of value in weeks during risk-off events.
- Correlation analysis: Measure rolling correlations between holdings. During the June 2026 outflow period, Bitcoin outflows reached $1,438 million and Ethereum outflows hit $257 million simultaneously, confirming that diversification across major assets provides limited protection during systemic sell-offs.
- Position sizing by regime: Reduce position sizes in high-volatility regimes identified through rolling percentile analysis. Larger positions in low-volatility accumulation phases and smaller positions in high-volatility distribution phases improve the risk-reward profile over time.
- Liquidity-adjusted sizing: Use order book depth data to size positions relative to available liquidity. Entering a large position in a thin market moves price against you before the trade is complete.
Automation plays a direct role in executing these controls consistently. AI-driven trading strategies apply rule-based risk parameters without the emotional override that causes most discretionary traders to hold losing positions too long or exit winning ones too early. The value of automation is not prediction. It is the consistent application of a pre-defined decision framework regardless of market conditions.
Pro Tip: Build your risk rules before you build your entry signals. A well-defined exit and position-sizing framework applied to a mediocre entry signal outperforms a precise entry signal with no exit discipline.
Key takeaways
Effective cryptocurrency analysis requires combining market data, on-chain metrics, and sentiment signals within a structured, regime-aware framework rather than relying on any single indicator.
| Point | Details |
|---|---|
| Combine three data types | Market, on-chain, and sentiment data each capture different dimensions; use all three together. |
| Regime detection first | Classify volatility regime before selecting any strategy to avoid misapplying indicators. |
| Sentiment improves returns | NLP-extracted sentiment integrated with technical indicators produces stronger risk-adjusted outcomes. |
| On-chain thresholds matter | The True Market Mean distinguishes sustainable rallies from short-lived bounces with structural reliability. |
| Automate risk controls | Rule-based execution removes emotional override and applies risk parameters consistently across all conditions. |
Why most traders underuse the data they already have
Most traders I observe have access to the right data. They track price, they check sentiment indexes, and some even pull on-chain metrics from Glassnode or Nansen. The failure point is almost never data access. It is the absence of a structured framework for integrating what they see.
The instinct to react to daily volatility is strong, and the crypto market feeds it constantly. A single negative news cycle can push the Fear & Greed Index from neutral to fear territory within 24 hours, and traders who treat that reading as a standalone signal often exit positions at the worst possible moment. The signal only becomes useful when it is cross-referenced against on-chain cost basis data and the current volatility regime.
What I have found consistently is that the traders who perform best over multi-month periods are not the ones with the most sophisticated models. They are the ones who have defined in advance what combination of signals constitutes a valid entry, a valid exit, and a regime change that suspends trading entirely. That pre-commitment removes the biggest source of error in discretionary crypto trading: the decision made under pressure.
The information transmission lag between large-cap and small-cap assets is a good example of an insight that sounds academic but has direct practical value. If you are watching Bitcoin’s reaction to a macro event and you understand that small-cap assets will lag by minutes, you have a structured basis for a repositioning decision. That is not prediction. It is pattern-based reasoning applied to a known market structure.
Automation and machine learning in crypto trading do not replace this analytical work. They execute it without hesitation once the framework is defined. The analytical work is still yours to do.
— Grisha
How Darkbot puts data-driven trading into practice
Translating data analysis into consistent execution is where most individual traders lose ground. The analytical framework may be sound, but manual execution introduces timing errors, emotional overrides, and inconsistent position sizing.
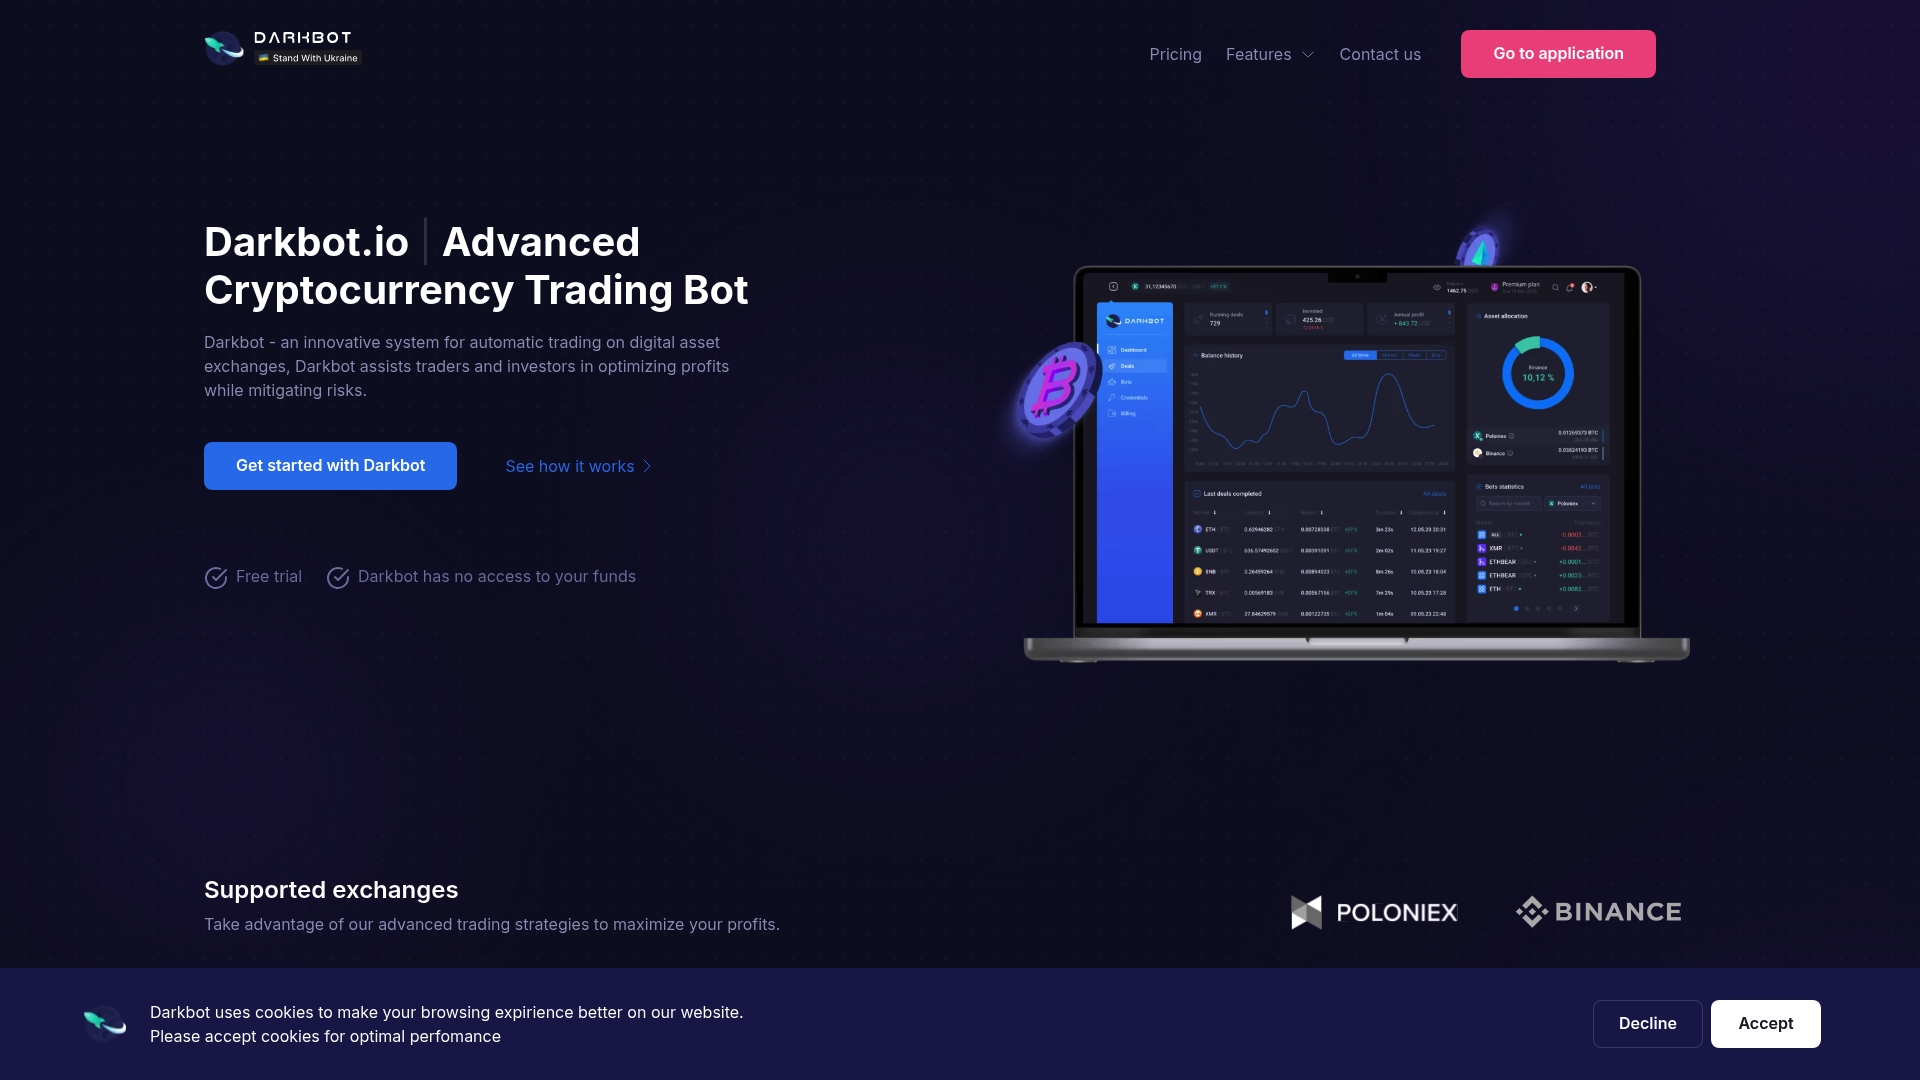
Darkbot is built to close that gap. The platform applies AI-driven logic to execute automated trading strategies across multiple exchanges, enforcing pre-defined risk parameters and portfolio rules without deviation. Portfolio rebalancing, position sizing by regime, and real-time analytics are integrated into a single interface, so the decision framework you build from your data analysis is the one that actually runs. For traders who have done the analytical work and want consistent execution behind it, Darkbot provides the infrastructure to make that happen. Explore Darkbot’s portfolio management tools to see how systematic execution applies to your strategy.
FAQ
What is data analysis in cryptocurrency?
Data analysis in cryptocurrency is the structured process of examining market price data, blockchain transaction records, and sentiment signals to inform trading and investment decisions. The goal is to extract repeatable, evidence-based signals rather than relying on intuition or reactive decision-making.
What are the most reliable data sources for crypto market analysis?
The most reliable sources combine exchange-level market data (Binance, Coinbase), on-chain analytics platforms (Glassnode, Nansen, Dune Analytics), and sentiment tools using NLP or LLM-based scoring. No single source is sufficient; cross-referencing across all three categories produces the most reliable signals.
How does sentiment analysis improve cryptocurrency trading decisions?
Sentiment analysis quantifies the market’s reaction to news and social media, providing early signals that price data alone cannot capture. Research shows that NLP-extracted sentiment integrated with technical indicators improves risk-adjusted returns compared to price-only strategies.
What is the True Market Mean and why does it matter?
The True Market Mean is an on-chain cost basis metric that marks the average acquisition price across active market participants. Price sustained above this level indicates structural bullish conviction; failure to hold above it signals that a rally lacks the on-chain support needed for continuation.
How can individual traders apply advanced crypto data analysis without coding skills?
Platforms like Glassnode and CoinGecko provide pre-built on-chain and market dashboards that require no coding. For automated execution of data-driven strategies, tools like Darkbot apply rule-based logic across exchanges without requiring manual programming, making systematic trading accessible to non-technical users.
Recommended

Start trading on Darkbot with ease
Come and explore our crypto trading platform by connecting your free account!
Free plan available • No credit card required