Out-of-Sample Testing: How to Validate Trading Models Right
Out-of-sample testing evaluates a model on data withheld from the fitting process entirely, non-overlapping with anything the model saw during training. It is the most reliable indicator of how a forecasting model or trading strategy will behave once deployed, because it approximates the one condition that actually matters: performance on data the model has never encountered.
The gap between in-sample and out-of-sample results is rarely small. Sharpe ratios measured out-of-sample typically degrade by 33% to 44% relative to their in-sample counterparts, according to Quantpedia’s analysis of published trading strategies. Any model that looks exceptional only in-sample and has not been stress-tested against a held-out period should be treated as unproven, not promising.
Key Takeaways
Out-of-sample testing works because it measures a model against conditions it never learned from, making it the closest available proxy for real deployment performance.
| Point | Details |
|---|---|
| Definition matters | Out-of-sample data must be genuinely unseen; any leakage invalidates the test. |
| Expect degradation | Sharpe ratios commonly fall 33% to 44% from in-sample to out-of-sample results. |
| Match method to data | Walk-forward validation fits time series; k-fold suits independent, non-sequential data. |
| Test across regimes | A model validated in only one market condition isn’t validated for live trading. |
| Log everything | Freeze data, pre-register acceptance criteria, and record every fold-level result. |
In-Sample vs Out-of-Sample: Definitions You Need First
The core distinction is mechanical: was this data point used to fit any parameter in the model? If yes, it’s in-sample. If no, it’s out-of-sample. That single question determines whether a performance number tells you anything real.
Generalization error is the formal name for the gap between how a model performs on its training data and how it performs on truly independent data. Every model has some generalization error. The question is whether it’s small enough to trust, and you can’t answer that without out-of-sample data. Wikipedia’s treatment of generalization error frames this as an unavoidable statistical property of any fitted model, not a flaw specific to bad modeling.
Three contamination sources quietly inflate in-sample results and make them look better than they are:
- Lookahead bias: using information that would not have been available at the time of the decision (e.g., a feature calculated with future price data).
- Data leakage: any pathway, direct or indirect, through which test-set information influences the training process.
- Survivorship bias: building or testing a strategy only on assets, exchanges, or datasets that still exist today, ignoring the ones that failed or delisted.
Cross-validation is the broader statistical family that formalizes out-of-sample estimation. As Wikipedia’s cross-validation entry describes it, these methods repeatedly partition data into training and validation subsets to estimate how a model generalizes, though the standard versions assume independence between observations, an assumption time series routinely violate.
Backtesting Methods: Holdout, K-Fold, and Walk-Forward Compared
Not every validation method fits every dataset. Picking the wrong one for time-series data is one of the most common ways traders fool themselves into deploying a broken model.
-
Simple holdout split. Divide the dataset once into a training block and a test block, commonly 70/30 or 80/20. It’s fast and easy to interpret, and it works reasonably well for very large, stationary datasets where a single split is representative. For anything with regime dependence, like crypto or equity markets, one split is a thin basis for a deployment decision.
-
K-fold cross-validation. The dataset is divided into k subsets; the model trains on k-1 folds and validates on the remaining one, rotating through all k combinations. This is excellent for roughly independent, identically distributed data. Applied naively to time series, it lets the model train on future data and test on the past, which silently reintroduces lookahead bias.
-
Rolling or walk-forward validation. The model trains on a fixed or expanding window, tests on the immediate next period, then rolls forward and repeats. A typical configuration trains on 24 months of data, tests on the following 6 months, then steps forward one month and repeats the cycle. This preserves chronological order at every step, which is why it’s the standard choice for trading and other time-dependent forecasting.
-
Monte Carlo / repeated random splits. Running many randomized train/test partitions (respecting time order where relevant) gives a distribution of performance outcomes rather than a single number, exposing how much variance exists across different market conditions.
Pro Tip: Run walk-forward validation across at least two distinct market regimes, one trending and one range-bound, before trusting the aggregate metric. A strategy that only survives one regime type isn’t validated; it’s curve-fit to that regime.
How Do You Choose the Right OOS Split Size?
Split size isn’t arbitrary, and getting it wrong is one of the easiest ways to produce a validation result that flatters a model without testing it.
A practical rule of thumb: your out-of-sample period should match or exceed the length of your in-sample period, and it should span more than one market regime. Practitioner guides on crypto strategy validation note that a common standard is requiring out-of-sample data equal in duration to the in-sample window, with many traders extending that to multiple years or rolling windows specifically to capture regime shifts that shorter tests miss.
Metric choice depends on what the model actually does:
- Pure forecasting models (price level, volatility, return prediction) are typically evaluated with RMSE or MSE, comparing predicted values against realized outcomes.
- Trading strategies need return-based and risk-adjusted metrics, primarily the Sharpe ratio, alongside maximum drawdown and win rate, since a strategy can post positive returns while carrying unacceptable risk.
On interpretation: expect the Sharpe ratio to fall. The 33% to 44% degradation range documented by Quantpedia is a reasonable baseline for what “normal” decay looks like. A strategy that loses less than that on an honest out-of-sample test is doing better than average. One that collapses to near zero or turns negative was likely overfit, regardless of how strong the in-sample backtest looked.
On window length versus frequency: longer single OOS windows are better for confirming a strategy survives a full market cycle, but multiple shorter walk-forward windows are better for detecting when a strategy starts failing, which matters more for live risk management than a single pass/fail verdict.
Why Out-of-Sample Results Still Get Misread
A clean-looking out-of-sample result is not automatically a trustworthy one. Several failure modes produce good-looking numbers that don’t hold up in live conditions.
- Regime change and nonstationarity. A model validated entirely during a low-volatility period will misrepresent its own risk profile the moment volatility spikes. Break the OOS period into subperiods and check whether performance is stable across each one, not just in aggregate.
- Multiple testing and data snooping. Testing dozens of parameter combinations against the same out-of-sample set and picking the best one defeats the purpose. Once you’ve used a dataset to select among candidates, it’s no longer truly out-of-sample for that final candidate. A holdout-of-holdout, a second, untouched dataset reserved purely for final confirmation, addresses this.
- Survivorship and selection bias in the data itself. If your historical dataset excludes delisted tokens or failed exchanges, your OOS test is quietly biased toward survivors.
- Feature leakage and lookahead bias. Any feature engineered with information not available at the timestamp being predicted invalidates the test. Time-aware feature engineering, computing every feature strictly from data available up to that point, prevents this.
- Parameter sensitivity. If small changes to a parameter produce wildly different OOS results, the model is fragile, even if one parameter setting happened to perform well.
Pro Tip: Before trusting an OOS result, test the same strategy logic with a deliberately simplified, reduced-parameter version. If the simple version performs nearly as well as the complex one, the extra complexity probably isn’t adding real predictive value.
A Step-by-Step Checklist for Running OOS Validation
A reproducible process matters more than any single metric, because it’s the only way to know whether a good result is real or a product of an inconsistent test.
- Freeze the dataset. Lock the data source, date range, and any preprocessing steps before running a single test. Document the random seed if any step involves randomization.
- Choose the windowing method. For time-dependent data, walk-forward is the default; document window lengths and step size in advance, not after seeing results.
- Run the validation and collect fold-level metrics. Don’t just record the aggregate number, log performance for each individual fold.
- Aggregate and check stability. Compute the mean and variance of your metric across folds. High variance across folds is itself a warning sign, even if the average looks acceptable.
- Apply a decision rule set in advance. Define what degradation from in-sample to out-of-sample is acceptable before you see the number, not after.
- Paper trade before going live. A final forward-testing period on real-time (but non-live) data catches issues that historical backtests, no matter how carefully built, can miss.
Operationally, this means keeping an experiment log: every test run, its configuration, and its result, timestamped and unchanged after the fact. For traders building this workflow, structured strategy testing before capital deployment is the difference between a strategy that survives contact with live markets and one that doesn’t.
How Platform Tooling Supports Disciplined OOS Workflows
Manual validation is where discipline usually breaks down. It’s easy to skip a fold, peek at results early, or quietly adjust a parameter after seeing an out-of-sample number, each one a small compromise that invalidates the test.
Darkbot’s platform architecture is built to remove that discretion from the process. Reproducible backtesting, automated walk-forward windowing, and paper trading operate on a consistent, systematic footing rather than manual, ad hoc runs.
Key features that support this:
- Automated walk-forward execution, removing the temptation to hand-pick favorable windows.
- Paper trading, providing a genuine forward-test period before any capital is committed.
- Secure API integration with major exchanges, keeping data pipelines consistent across test and live environments.
- Experiment logging, preserving a record of every configuration tested, which supports the kind of machine learning workflows that depend on consistent, auditable validation.
Pro Tip: A 12-month rolling validation run followed by a dedicated paper-trading period is a reasonable minimum cadence before considering live deployment of any automated strategy, regardless of how strong the backtest looks.
Nested Cross-Validation for Model Selection
Choosing hyperparameters and evaluating final performance with the same validation split creates a subtle but serious problem: the model selection process itself becomes a form of overfitting to that validation set.
Nested cross-validation solves this with two loops instead of one. An inner loop handles hyperparameter tuning, running its own train/validation splits to pick the best configuration. An outer loop then evaluates that selected configuration on a completely separate fold that played no role in tuning. The outer loop’s result is the genuinely unbiased estimate of generalization performance.
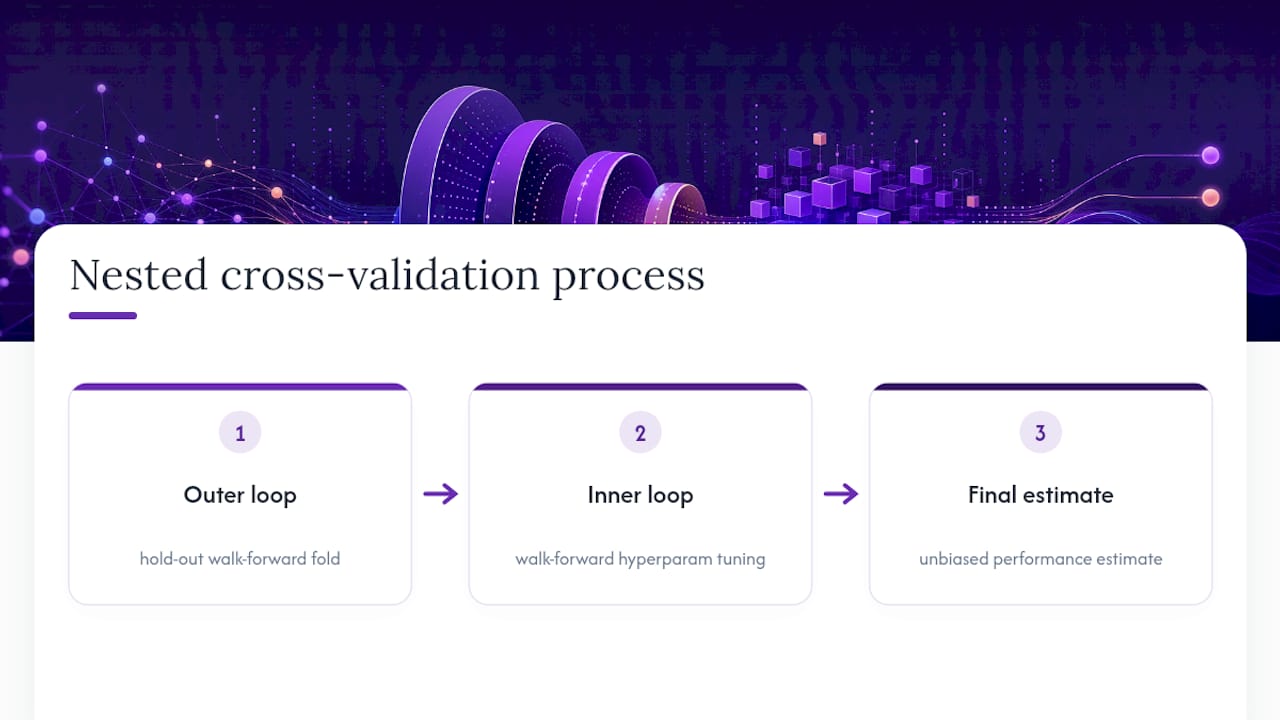
For time-series and trading applications, both loops need to respect chronological order, an inner walk-forward process nested inside an outer walk-forward process. This is computationally heavier than a single-loop validation, since you’re effectively running many backtests to tune parameters before running the real evaluation. But the payoff is a performance estimate that hasn’t been contaminated by the tuning process itself.
A practical compromise for traders with limited compute: use nested cross-validation for final strategy confirmation, even if a simpler walk-forward split is used during earlier development iterations. Reserve the full nested process for the shortlist of strategies that have already cleared basic validation, rather than running it on every candidate from the start.
Keeping Data Integrity Intact During OOS Testing
Data snooping, using the same dataset repeatedly to test and refine a strategy, is one of the most common ways an out-of-sample test stops being genuinely out-of-sample. Each time you peek at results and adjust the model, the “unseen” data becomes a little more seen.

A few practices protect against this. First, split your data into three parts rather than two: training, validation (for tuning), and a final holdout that gets touched exactly once, at the very end. Second, set your acceptance criteria before running the final test, not after. Deciding “we’ll accept anything above a 0.8 Sharpe” after seeing a 0.79 result defeats the purpose of pre-registration.
Third, audit your data pipeline for asymmetric information. A dataset that includes restated financial figures, corrected after the fact, or delisted assets removed retroactively, introduces information that wasn’t actually available at the time being simulated. Comprehensive out-of-sample evaluation frameworks grounded in statistical decision theory address this directly by forcing an explicit specification of what population and time period the model is being evaluated against, rather than assuming the future will resemble the training sample.
Version-controlling both your data and your code, so you can reconstruct exactly what a model saw at any point in its development, is the most practical safeguard available.
OOS Testing Outside Trading: Healthcare and Marketing
Out-of-sample testing isn’t a trading-specific concept; it’s a general principle of statistical model validation, and other fields apply it under real constraints that trading practitioners can learn from.
In healthcare, predictive models for patient risk (readmission likelihood, disease progression) are validated on out-of-sample patient cohorts, often drawn from a different hospital system than the training data. This matters because a model trained on one hospital’s patient population can perform substantially worse when applied to a different demographic mix, a direct parallel to regime shift in trading markets.
In marketing, customer churn and lifetime-value models are tested against out-of-sample customer cohorts, typically customers who signed up after the model was trained. A model that predicts churn well on historical customers but fails on new cohorts has likely fit to a marketing campaign or seasonal pattern rather than a durable behavioral signal, the same overfitting failure that shows up in a curve-fit trading strategy.
The common thread across all three domains: a model’s real value only becomes clear when it faces data that reflects genuinely new conditions, not a repeat of what it already learned from.
Handling Non-Stationary Data in Out-of-Sample Tests
Financial time series are rarely stationary. Volatility clusters, correlations between assets shift, and the statistical relationships a model learned during one period can simply stop holding in the next. This is the single biggest reason a well-validated model can still fail live.

A few techniques help manage this directly. Subperiod analysis breaks the OOS test window into shorter chunks and checks performance consistency across each one rather than trusting a single aggregate number, surfacing exactly where a model starts to break down. Rolling recalibration periodically refits model parameters on recent data within a walk-forward loop, letting the model adapt to gradual drift instead of relying on parameters fit years earlier.
Structural break detection, statistical tests that flag when the underlying data-generating process appears to have shifted, can trigger a recalibration or a pause in live deployment. Practitioners are increasingly building this into their validation frameworks directly rather than assuming stationarity, treating the possibility that the future won’t resemble the past as a design constraint, not an edge case.
Finally, favor models and features that degrade gracefully rather than catastrophically when conditions shift. A simpler model with modest but stable performance across regimes is usually a better deployment candidate than a complex one that excels in a single regime and fails outside it, a principle strategy design frameworks built around rule-based, systematic execution are built to enforce.
What Traders Consistently Get Wrong About Validation
The conventional advice on out-of-sample testing stops at “split your data and check the numbers.” That’s necessary but not sufficient, and it’s why so many strategies that pass a basic OOS check still fail live. The real discipline isn’t in running the split; it’s in refusing to touch the holdout data more than once and in defining acceptance thresholds before you see a result.
What’s overrated is chasing a single impressive backtest metric. What’s underrated is stability across subperiods and regimes, a strategy with a mediocre but consistent Sharpe ratio across five different market conditions tells you more than one with a spectacular number from a single bull run. Structural breaks are not an edge case to handle later; they should be a design assumption from the start, given how often markets simply stop behaving the way they did during training.
If there’s one priority for readers to take from this: build the walk-forward loop and the pre-registered decision rule before you build the strategy’s alpha logic. Validation discipline that’s bolted on afterward rarely catches what it was meant to catch.
— Grisha
This article is general information, not a substitute for advice from a qualified financial advisor. Consult a qualified financial professional about your own circumstances before acting on anything here.
Sources
For readers who want to go deeper into the statistical foundations covered here, the Tashman review in the International Journal of Forecasting remains a foundational academic treatment of out-of-sample forecast testing methodology. Eurostat’s statistical glossary offers a concise, practitioner-accessible explanation of why out-of-sample evidence outranks in-sample evidence for forecast trustworthiness. Wikipedia’s entries on cross-validation and generalization error provide accessible technical grounding for the validation methods discussed throughout this article. For the more advanced statistical framework referenced in the data integrity section, the arXiv paper on comprehensive out-of-sample evaluation using decision theory is worth a full read.
- What is the difference between in-sample and out-of-sample forecasting — Zilliz AI FAQ
- Comprehensive out-of-sample evaluation using statistical decision theory — arXiv (2024)
FAQ
What Does “Out of Sample” Mean?
It means data that was not used to fit or train a model, evaluated separately to check how the model performs on genuinely new information rather than data it has already learned from.
What Is the Difference Between In-Sample and Out-of-Sample Forecasting?
In-sample forecasting measures accuracy on the same data used to build the model, which tends to overstate performance; out-of-sample forecasting tests the model on withheld data and is considered more trustworthy because it reflects real-world conditions.
How Much Performance Degradation Is Normal Out of Sample?
Out-of-sample Sharpe ratios typically fall 33% to 44% compared to in-sample results; degradation beyond that range often signals overfitting.
Is K-Fold Cross-Validation Suitable for Trading Strategies?
Standard k-fold cross-validation is generally not appropriate for time series because it can let a model train on future data and test on the past; walk-forward validation preserves chronological order and is the standard alternative.
What Is Nested Cross-Validation Used For?
Nested cross-validation separates hyperparameter tuning from final performance evaluation using two validation loops, preventing the model selection process from biasing the final generalization estimate.
Recommended

Start trading on Darkbot with ease
Come and explore our crypto trading platform by connecting your free account!
Free plan available • No credit card required