Real-Time Analytics Trading Guide for Crypto Traders
TL;DR:
- Real-time analytics trading involves processing live market data streams within milliseconds to execute decisions rapidly. It relies on essential tools like DOM, Time and Sales, Footprint charts, and CVD indicators, which should be added gradually to avoid conflicting signals. Building low-latency pipelines with WebSocket feeds, decoupled storage, and continuous monitoring enhances data accuracy and strategy reliability in volatile crypto markets.
Real-time analytics trading is the practice of consuming live market data streams, processing them through indicators and pipeline logic, and executing decisions within milliseconds rather than minutes. This guide to real-time analytics trading covers the tools, architectures, and operational disciplines that separate systematic crypto traders from those reacting to stale data. Real-time access enhances speed without replacing fundamental trading skills, which means the infrastructure you build must serve a disciplined process, not substitute for one. Platforms like TradingView, Alpaca, and Darkbot each occupy a distinct layer in that process, from visualization to data delivery to automated execution.
What are the essential tools and indicators for real-time crypto analytics?
Real-time analytics for trading begins with four core indicator types: Depth of Market (DOM), Time and Sales (tape), Footprint/Cluster charts, and Delta/Cumulative Volume Delta (CVD). Each one answers a different question about what is happening in the order book right now.
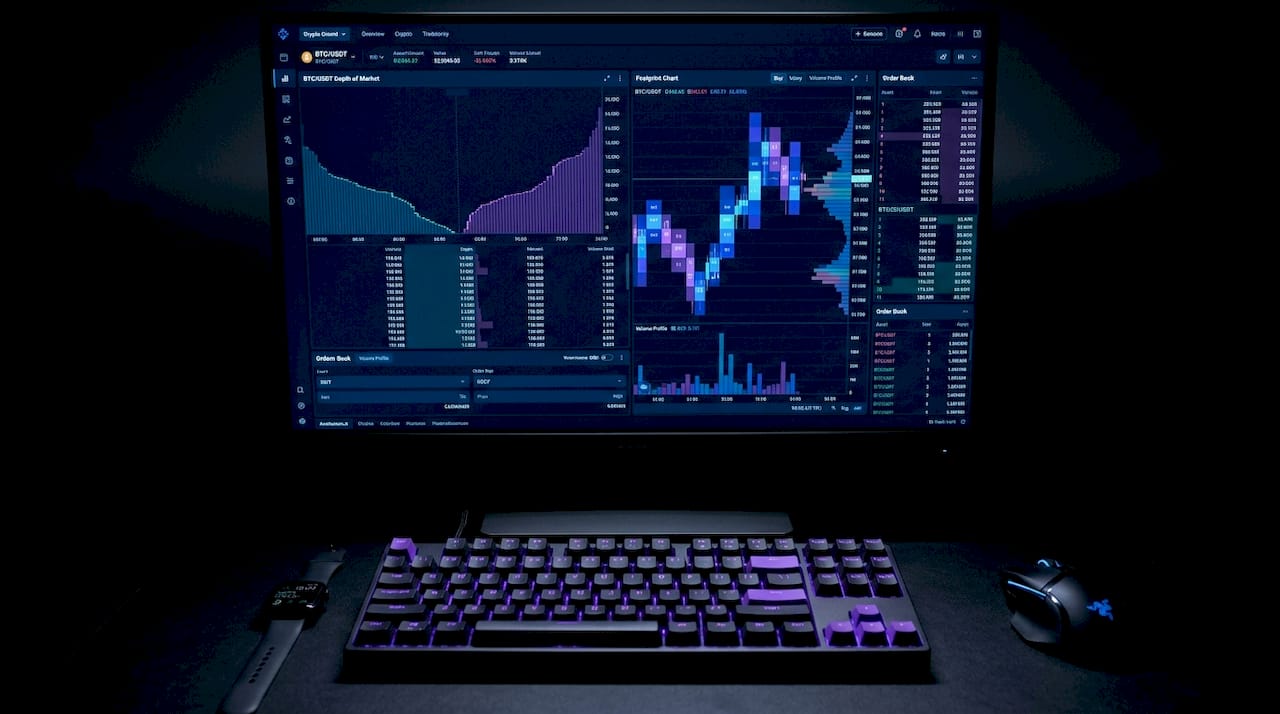
DOM shows the live queue of resting buy and sell orders at each price level. Traders use it to identify liquidity walls, absorption zones where large orders absorb aggressive flow without price moving, and thin areas where price can gap quickly. Time and Sales records every executed trade in sequence, revealing whether buyers or sellers are initiating transactions. When large prints cluster on the bid side, selling pressure is dominant regardless of where price is trending on a candlestick chart.
Order flow analytics uses Footprint charts and CVD to detect divergences between price and volume delta, identifying weakening buying or selling pressure before a reversal becomes visible on price alone. A footprint chart overlays executed buy and sell volume at each price level within a candle, making absorption and imbalance visible at a granular level. CVD accumulates the net delta over time, so a rising price with falling CVD signals that buyers are losing conviction.
| Indicator | Primary function | Best use scenario | Key limitation |
|---|---|---|---|
| DOM (Depth of Market) | Visualize resting order queue | Identifying liquidity walls and absorption | Orders can be spoofed or pulled instantly |
| Time and Sales | Log every executed trade | Confirming aggressor direction | High volume makes manual reading impractical |
| Footprint/Cluster chart | Show buy/sell volume per price level | Spotting imbalances within candles | Requires high-quality tick data feed |
| Cumulative Volume Delta | Track net buying vs. selling pressure | Detecting trend divergence early | Resets at session open, context-dependent |
Pro Tip: Add only one order flow indicator at a time to your live chart. Traders who stack DOM, footprint, and CVD simultaneously often freeze at decision points because the signals conflict at the tick level. Start with CVD for trend context, then add footprint for entry precision.
How to set up a low-latency real-time analytics data pipeline
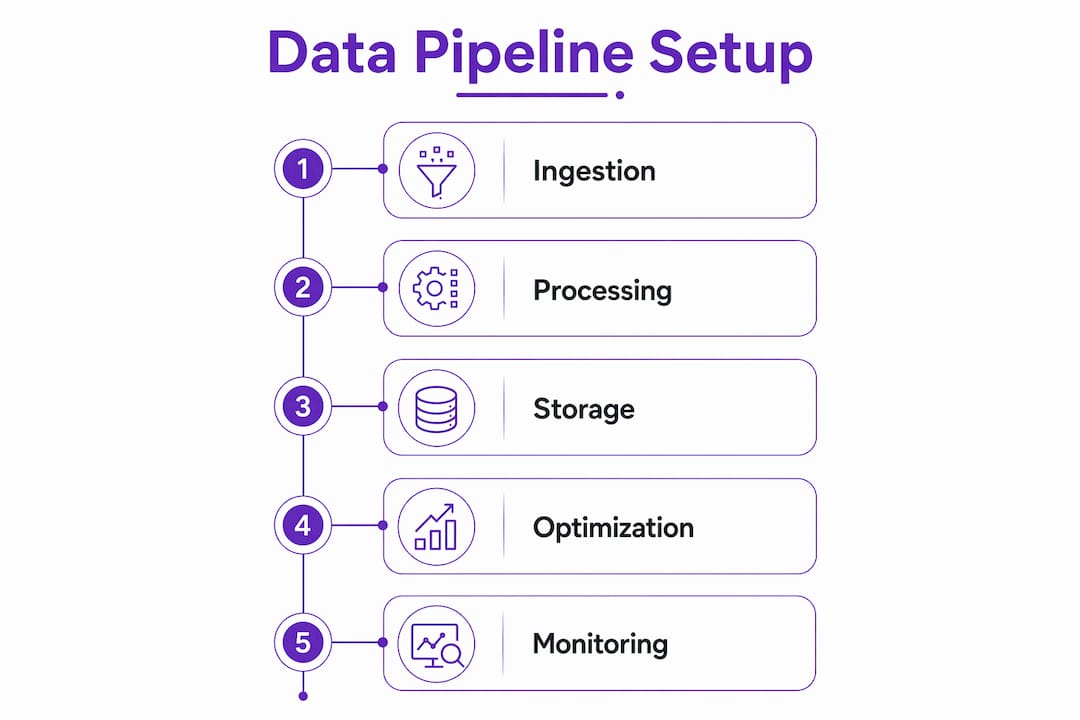
A production-grade pipeline for crypto trading analytics has three layers: ingestion, processing, and storage. Each layer introduces latency, and the goal is to minimize the cumulative total while maintaining data integrity.
At the ingestion layer, WebSocket streaming APIs are the standard choice. Alpaca’s crypto data feed streams trades, quotes, order books, and minute bars in real time, with minute bars emitting updates for late trades to improve accuracy. This matters because assuming a minute bar is final before the update window closes causes silent signal drift in any indicator that reads bar close values.
The TradePulse reference architecture demonstrates what a well-designed pipeline looks like at scale. It processes 10,000+ events per second while maintaining sub-100 ms end-to-end latency, using hot storage for recent ticks and cold storage for historical data. That architecture also correlates breaking news with unusual trading volume within 60-second temporal windows, producing compound signals that neither stream generates alone.
For most crypto traders building their own pipeline, a practical reference implementation achieves sub-500 ms latency using WebSocket ingestion, rolling window indicator computation, and TimescaleDB for storage. The key design choice is decoupling signal computation from persistence. Async batch writes every 1.5 seconds handle storage without blocking the signal path, and continuous aggregates handle OHLCV candle construction automatically.
Here is a step-by-step approach for constructing a reliable pipeline:
- Connect via WebSocket to your exchange or data provider (Alpaca, Binance, or a normalized aggregator). Subscribe only to the symbols and data types you need to reduce message volume.
- Normalize incoming messages into a consistent schema immediately on receipt. Different exchanges format timestamps, trade IDs, and side indicators differently.
- Compute rolling indicators in memory using a circular buffer. Avoid recalculating from raw history on every tick.
- Decouple persistence from signal computation. Write to TimescaleDB or a similar time-series store asynchronously so storage I/O does not block indicator updates.
- Monitor p50, p95, and p99 latency percentiles alongside consumer lag. Micro-batching introduces a ~100 ms latency floor versus tens of milliseconds for true event-at-a-time streaming, so choose the processing model that matches your strategy’s timing requirements.
Pro Tip: Optimize the signal path and the persistence path separately. A smooth dashboard does not confirm that data is arriving in real time. Always monitor consumer lag directly at the queue level, not through the UI.
What are the best practices for integrating real-time analytics into systematic strategies?
Systematic crypto trading strategies built on real-time data require a specific discipline: the strategy must be testable, repeatable, and designed around the actual update semantics of the data it consumes.
Forward testing on live data validates a strategy’s predictive power under real market conditions before capital is committed. This is distinct from backtesting, which uses historical data and cannot replicate the latency, slippage, or data arrival order of a live environment. QuantInsti defines forward testing as observing real-time strategy behavior on unused data, which is the minimum standard before live deployment.
Signal ranking and liquidity filtering are two practices that separate reliable strategies from overfit ones. Signal ranking scores each potential trade by the strength and alignment of multiple indicators, such as CVD divergence plus DOM absorption at a key level, rather than acting on any single trigger. Liquidity filtering rejects trade signals when the order book depth at the target price is insufficient to fill the position without moving the market.
A critical error in real-time strategy design is treating slower REST endpoints as execution-timing signals. CoinMarketCap API endpoints update approximately every 60 seconds, making them appropriate for opportunity discovery and ranking but not for precise entry or exit timing. Using a 60-second polling endpoint to trigger a trade in a market that moves in milliseconds introduces structural latency that no amount of optimization can fix.
Before any trade submission, apply these verification steps:
- Confirm the signal timestamp is within your acceptable staleness window (typically under 500 ms for active strategies).
- Verify order book depth at the target price covers your intended position size.
- Check that no late trade updates are pending on the current minute bar if your strategy reads bar close values.
- Validate that risk parameters (position size, stop distance) are within pre-defined limits before sending the order.
Pro Tip: Build your strategy around AI-driven optimization methods that separate signal generation from order submission. A signal that passes all filters should still go through a final risk check before execution. This single gate catches the majority of erroneous trades caused by data edge cases.
What common challenges arise in real-time crypto analytics trading?
The most common failure mode in real-time analytics is not a broken feed. It is a feed that appears healthy while delivering stale or duplicated data. Three specific problems account for the majority of silent strategy degradation.
Consumer lag occurs when your processing pipeline cannot keep up with the incoming message rate. The WebSocket connection stays open and the dashboard looks live, but the indicators are computing on data that is seconds or minutes old. Monitoring consumer lag at the queue level, not through the UI, is the only reliable way to detect this condition. A smooth chart does not guarantee real-time data delivery.
Late trade updates cause silent drift in bar-based indicators. Alpaca’s minute bars, for example, emit updates after the bar closes to incorporate trades that arrived late. Any strategy that reads bar close values and acts immediately on bar close will sometimes act on a preliminary value that changes seconds later. The fix is to add a short confirmation delay or to use tick-level data rather than bars for entry signals.
Data duplication happens when reconnection logic replays messages after a WebSocket drop. Without exactly-once processing semantics, a reconnect can feed duplicate trades into your CVD calculation, inflating delta and generating false signals.
A practical troubleshooting checklist for pipeline health:
- Check consumer lag at the queue level every 30 seconds during live trading sessions.
- Log the timestamp delta between message creation and message processing for every event.
- Implement idempotency keys on trade messages to detect and discard duplicates.
- Set checkpoint duration alerts: if a checkpoint takes longer than your p99 latency target, the pipeline is under stress.
- Calibrate async batch write intervals. Async batch writes every 1.5 seconds balance compute overhead against sub-500 ms signal freshness, but this interval needs tuning based on your message volume.
Pro Tip: Treat your pipeline health dashboard as a trading instrument. Review latency percentiles and consumer lag before each session, not just when something breaks. Most silent data quality issues are visible in the metrics days before they cause a strategy failure.
Key takeaways
Real-time analytics trading requires low-latency data pipelines, disciplined indicator use, and systematic verification at every stage from ingestion to order submission.
| Point | Details |
|---|---|
| Use order flow indicators selectively | DOM, CVD, and footprint charts each serve a distinct purpose; stacking all three creates decision paralysis. |
| Decouple signal and storage paths | Async batch writes keep persistence from blocking indicator computation and maintain sub-second responsiveness. |
| Forward test before live deployment | Backtesting alone cannot replicate live latency, slippage, or data arrival order. |
| Monitor consumer lag directly | A smooth dashboard does not confirm real-time data delivery; check queue-level lag every session. |
| Match data source to use case | REST endpoints updating every 60 seconds are for opportunity discovery, not execution timing. |
Real-time data is a tool, not a strategy
I have watched traders spend months building technically impressive pipelines, only to trade worse than before because they confused data freshness with decision quality. Real-time analytics removes information latency. It does not remove the need for a well-defined edge.
The tradeoff I see most often is between latency and operational complexity. A sub-100 ms pipeline is achievable, but it requires WebSocket management, idempotency logic, late-trade handling, and continuous monitoring. For most systematic crypto traders, a well-maintained sub-500 ms pipeline with rigorous signal verification outperforms a theoretically faster system that introduces data quality errors under load.
The other pattern worth naming is overfitting to noise. Real-time data is granular, and granular data contains a lot of randomness. Traders who optimize their strategies against tick-level noise in backtesting often find that the same strategies fail in forward testing because the noise patterns do not repeat. The discipline is to use real-time data for execution timing and confirmation, while keeping the core strategy logic at a higher timeframe where signal-to-noise ratios are more stable.
Darkbot’s approach to machine learning in crypto trading reflects this balance: AI handles probabilistic pattern evaluation and rule-driven adaptation, while the trader defines the risk parameters and strategy logic. That division of responsibility is the right one.
— Grisha
How Darkbot applies real-time analytics to automated crypto trading
Darkbot is an AI-based crypto trading automation platform built around systematic execution, structured risk control, and repeatable strategy logic. It connects to exchanges via API keys and applies rule-driven adaptation to manage positions across volatile markets without requiring manual intervention on every signal.
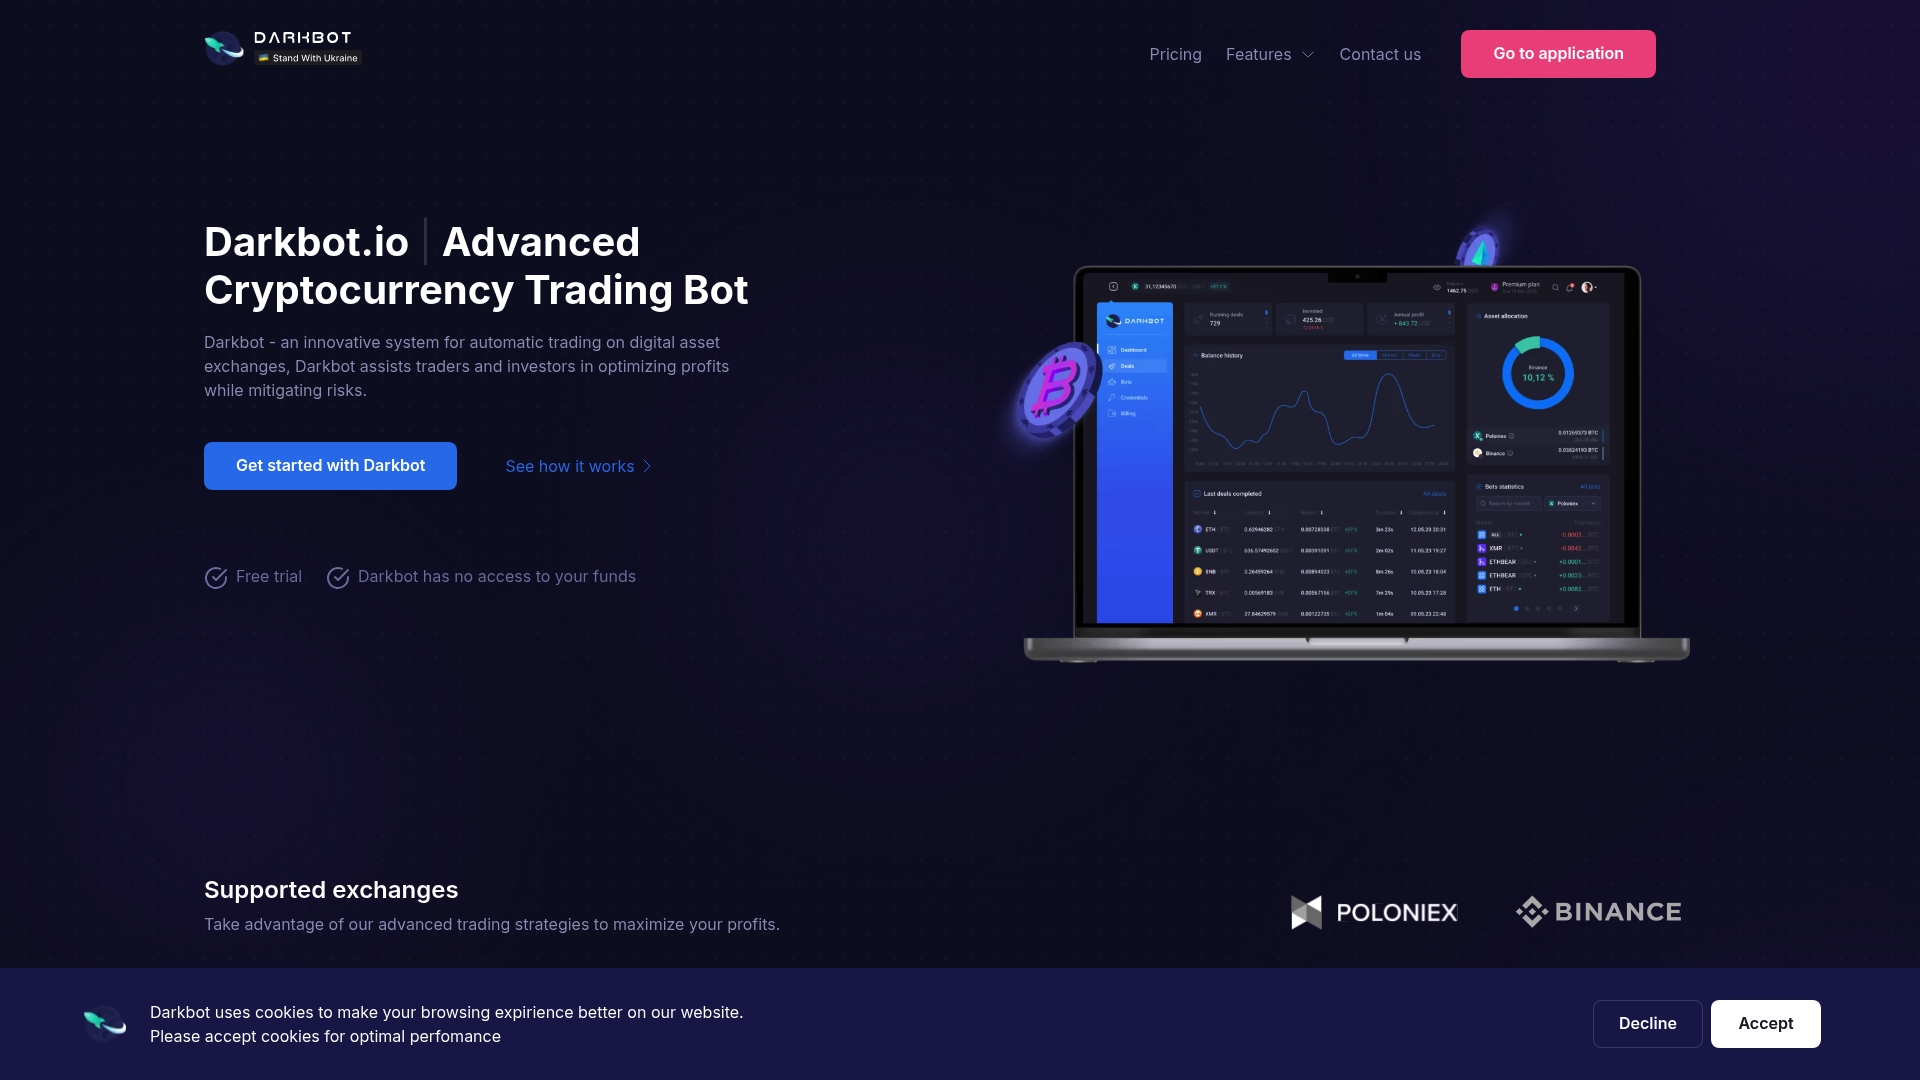
For traders who have worked through the pipeline and indicator concepts in this guide, Darkbot provides the execution layer that puts those concepts into practice. Its architecture integrates real-time data feeds with automated strategy execution and portfolio-level risk controls, so the gap between a validated signal and a submitted order is governed by logic rather than reaction time. Explore Darkbot’s portfolio management tools to see how real-time analytics and automated rebalancing work together in a single platform.
FAQ
What is real-time analytics trading?
Real-time analytics trading is the practice of consuming live market data streams and processing them through indicators or automated logic to make trading decisions within milliseconds. It contrasts with batch-based approaches where data is analyzed after a delay.
What tools are used for real-time crypto analytics?
The core tools are DOM, Time and Sales, Footprint/Cluster charts, and Cumulative Volume Delta indicators, typically accessed through platforms like TradingView or via WebSocket APIs such as Alpaca’s crypto data feed.
How do I reduce latency in a crypto data pipeline?
Use WebSocket streaming instead of REST polling, decouple signal computation from storage with async batch writes, and monitor p50/p95/p99 latency percentiles alongside consumer lag to detect bottlenecks before they affect signal quality.
Why does forward testing matter for real-time strategies?
Forward testing exposes how a strategy behaves under live latency, slippage, and real data arrival order, none of which backtesting can replicate accurately. QuantInsti identifies it as the minimum validation step before live capital deployment.
What causes silent signal drift in real-time trading systems?
Silent drift most often results from late trade updates on minute bars, consumer lag that makes indicators compute on stale data, or data duplication after WebSocket reconnections. Each condition produces incorrect indicator values without triggering any visible error.
Recommended

Start trading on Darkbot with ease
Come and explore our crypto trading platform by connecting your free account!
Free plan available • No credit card required