Risk Management Workflow for Traders: Practical Rules
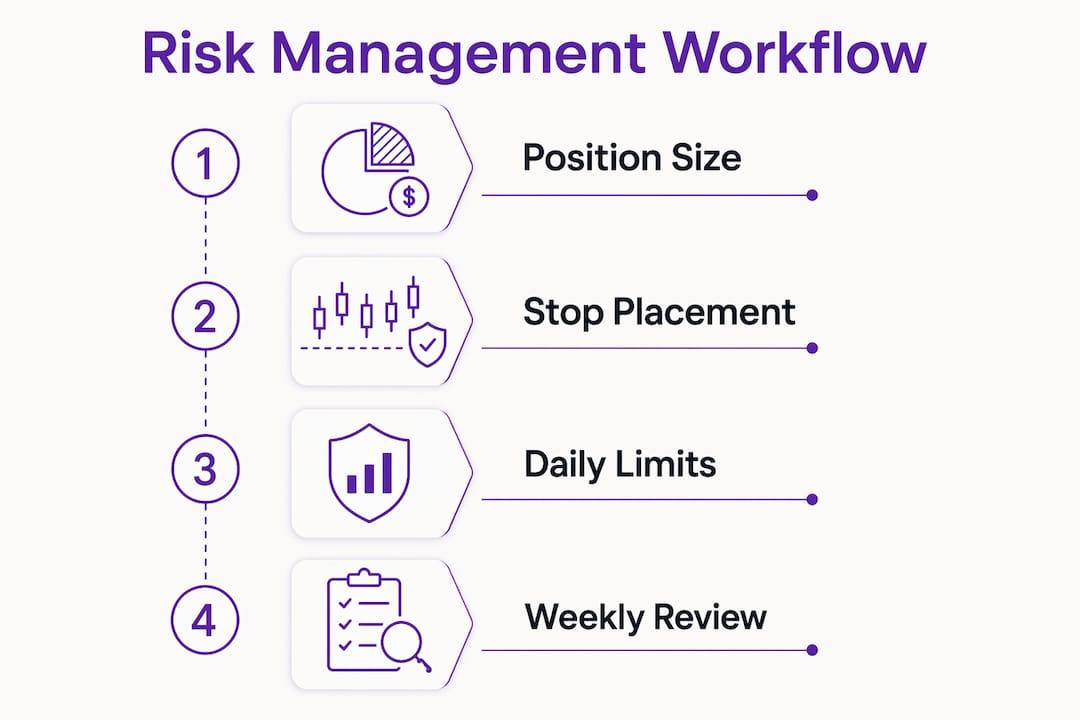
A four-layer risk management workflow — position sizing, stop-loss placement, daily loss limits, and a weekly review — is the most direct way to limit losses and stay in the market long enough for an edge to pay off. The numeric defaults most practitioners start with: risk 1–2% per trade, caps daily losses at 3% of equity, and trigger a full trading halt at 8–12% total drawdown. These are starting points calibrated to survivability, not universal laws. Before any order, run this five-point pre-entry check: entry price defined, stop at invalidation, position size calculated, daily loss headroom confirmed, and no high-impact event within the session. The SEC and CFTC both emphasize capital preservation as the foundation of sound trading practice, and most funded-account programs enforce drawdown caps within a moderate range as a hard kill-switch.
- Position sizing: controls how much capital is at risk per trade
- Stop-loss placement: defines the exit point before the trade is entered
- Daily/drawdown limits: caps cumulative loss at the session and account level
- Weekly review: audits compliance, catches bias, and adjusts parameters
What risk management in trading actually means
Risk management is a system of pre-declared rules that controls loss at three levels simultaneously: the individual trade, the open portfolio, and the total account. It is not the same as money management. Money management covers how capital is allocated across strategies and instruments. Risk management constrains how much of that capital can be lost at any exposure point.

The distinction matters because a trader can follow sound money management — spreading capital across five strategies — and still blow up if no rule limits how much each strategy can lose before it is shut down. The four-layer workflow described in this article operates at all three levels at once, which is why it works where simpler “use a stop-loss” advice fails.
What risk types does your trading plan need to cover?
Every layer of the workflow is designed to catch a specific category of risk. Knowing which risk type each layer targets makes the rules easier to follow and easier to defend when you are tempted to override them.
- Market risk: adverse price movement in any direction. Primary defense: stop-losses and position sizing.
- Volatility risk: large, fast swings that blow through stops before you can react. Defense: size down when Average True Range (ATR) expands; widen stops to structural levels.
- Liquidity risk: inability to exit at a fair price in thin markets or off-hours. Defense: trade liquid instruments; reduce size during illiquid sessions.
- Leverage/margin risk: borrowed exposure amplifies losses and can trigger forced liquidations. Defense: size by risk percentage, not by available margin.
- Gap risk: price jumps past your stop overnight, on weekends, or around news. Defense: reduce overnight size; use guaranteed stop-loss orders where available.
- Correlation/concentration risk: multiple positions that look diversified but move together. Defense: correlation-aware sizing and portfolio heat tracking.
- Operational/execution risk: platform outages, order rejections, API failures. Defense: pre-session system checks; redundant order types (OCO, stop-limit).
- Event risk: scheduled economic releases or unscheduled news that spike volatility. Defense: check the economic calendar before every session; reduce size or stay flat around major events.
- Behavioral risk: emotional overrides — averaging down, moving stops, revenge trading. Defense: automation lockouts and mandatory journal tags.
Crypto traders face an amplified version of gap risk (weekend moves routinely exceed 10%), exchange outage risk, and extreme correlation among altcoins when Bitcoin dominance shifts. The daily limit and kill-switch layers are especially critical in crypto for exactly this reason.
The four-layer defensive workflow: formulas and a worked example
The four layers work in sequence: position sizing limits per-trade exposure, stop placement defines the exit, daily and drawdown limits cap cumulative damage, and the weekly review catches what the rules missed. Each layer is a circuit breaker for the one above it.

Layer 1: Position sizing
The core formula is straightforward:
Position size = Allowed risk ($) ÷ Stop distance ($)
To get allowed risk in dollars: Allowed risk ($) = Account equity × Risk % per trade
Worked example. Account equity: $20,000. Risk per trade: 1% ($200). Entry on a stock at $50.00, stop at $48.50. Stop distance: $1.50 per share.
Position size = $200 ÷ $1.50 = 133 shares
If the stop is hit, the loss is exactly $200 — 1% of equity — regardless of how the trade felt in the moment.
For crypto perpetuals or futures, convert to contracts or units using the same logic. The math does not change; only the contract multiplier does.
Volatility adjustment: when ATR is elevated, the stop distance widens to avoid being stopped out by noise. That wider stop reduces the calculated position size automatically, which is the correct response to higher volatility. Advanced practitioners apply a correlation factor — typically 0.7x when trading two correlated assets simultaneously — to prevent hidden concentration from doubling effective risk.
Layer 2: Stop-loss placement
Place the stop at the point where the trade idea is invalidated, not at an arbitrary percentage below entry. A stop placed at a round number or a fixed 1% below entry is not a structural stop — it is a guess. Structural stops sit below a swing low, above a swing high, or outside the ATR range of the relevant timeframe.
Pro Tip: Automate stop entry as part of the order ticket. An OCO (one-cancels-the-other) order attaches the stop and target simultaneously, so the stop is live the moment the entry fills — no manual step, no forgotten stop.
Layer 3: Daily loss limits and the kill-switch
The cascading limit system works so that once the daily loss cap is reached, trading stops for the session. Once the total drawdown limit is reached, trading stops until a formal review is completed. Risk levels and dollar impacts scale proportionally with account size, and kill-switch thresholds allow absorbing multiple consecutive losses before halting trading.
At 1% risk per trade, a 12% kill-switch absorbs 12 consecutive full losses before the halt triggers. That is a long losing streak by any statistical measure, which means the halt is a genuine safety net, not a hair trigger.
Slippage and correlation both erode these buffers. If two correlated positions each carry 1% risk and they move together, the effective per-trade risk is closer to 2%. Factor that in before the trade, not after.
Layer 4: Weekly review
Covered in detail in the metrics section below. The short version: the review is where you audit compliance, measure whether actual risk matched planned risk, and tag any behavioral breaches for root-cause analysis.
What should your pre-trade checklist include?
Run this checklist before every order. The goal is to make impulsive entries structurally impossible by requiring each answer before the order ticket opens.
Pre-trade checklist:
- [ ] Instrument is liquid enough for the intended size (bid-ask spread acceptable, volume sufficient)
- [ ] Economic calendar checked — no high-impact event within the session or overnight hold
- [ ] Stop defined at the structural invalidation point, not an arbitrary level
- [ ] Position size calculated using the formula above and confirmed against daily loss headroom
- [ ] Total daily P&L checked — enough room remains before the daily cap
- [ ] Correlation check run if other positions are open (effective combined risk within limit)
- [ ] Trade reason written in one sentence (if you cannot state it, do not take it)
Order-entry template (copy into your journal or order ticket):
A written risk management plan with this template printed and kept beside the screen materially increases compliance — not because the math is hard, but because the physical act of filling it in interrupts impulsive entries.
Automation options for enforcement:
- Use OCO orders to attach stop and target simultaneously at entry.
- Set API order parameters (stop-limit, TIF conditions) to enforce exit rules without manual intervention.
- Use broker-provided guaranteed stop-loss products for overnight or weekend positions where gap risk is elevated.
- Configure platform alerts to notify when daily P&L approaches the cap, before it is breached.
Pro Tip: A simple spreadsheet that auto-calculates position size from equity, risk %, and stop distance eliminates arithmetic errors under pressure. Many funded-account traders use exactly this — nothing more complex is required for the pre-trade check.
How do you manage a trade once it is open?
Have written, pre-declared rules for partial exits, breakeven moves, and trailing stops before the trade is live. Deciding these in the moment is where discipline breaks down.
Exit framework:
- Partial close at +1R: close 50% of the position when price reaches the first target (1× the initial risk distance). This locks in a partial profit and reduces exposure.
- Move stop to breakeven after +1R: once the partial is closed, move the stop on the remaining position to the entry price. The trade is now risk-free on the remaining size.
- Trail after +2R: use an ATR-based trailing stop on the remainder. A common setting is 1.5–2× ATR on the entry timeframe, moved only in the direction of the trade.
The explicit prohibition: never widen a stop to “let it breathe.” Widening a stop after entry changes the risk profile of the trade retroactively. If the original stop was placed at the structural invalidation point, moving it further out means the original analysis was wrong — and the correct response is to exit, not to give the trade more room.
Execution quality should be audited as part of trade management. Track average slippage, order rejection rate, and the gap between planned fill price and actual fill. Consistent slippage above a few basis points erodes expected value and should be factored into position sizing and risk calculations.
Which metrics should you track, and how does the weekly review work?
Regular metric tracking and a fixed weekly review are the difference between a trader who improves and one who repeats the same mistakes. Without a formal review layer, rule drift and behavioral biases accumulate undetected.
Core metrics table:
| Metric | Why it matters | Formula / method |
|---|---|---|
| Expectancy | Measures average $ earned per $1 risked | (Win rate × Avg win) − (Loss rate × Avg loss) |
| Return-to-drawdown ratio | Balances return against the pain taken to get it | Net return ÷ Max drawdown |
| Max drawdown | Worst peak-to-trough equity decline | (Peak equity − Trough equity) ÷ Peak equity |
| Avg risk per trade | Confirms sizing discipline | Sum of $ risks ÷ Number of trades |
| Planned vs actual risk gap | Catches slippage and sizing errors | Planned $ risk − Actual $ risk per trade |
| Average slippage | Measures execution quality | Planned fill − Actual fill, averaged |
| Win rate | Context for expectancy | Winning trades ÷ Total trades |
| Profit factor | Gross profit vs gross loss | Gross profit ÷ Gross loss |
| Rule adherence score | Measures workflow compliance | Compliant trades ÷ Total trades × 100 |
Return-to-drawdown worked example. Net monthly return: 4%. Max drawdown during the month: 3.5%. Return-to-drawdown ratio: 4 ÷ 3.5 = 1.14. A ratio above 1.0 means the return exceeded the worst drawdown taken to achieve it. Below 1.0 signals that the risk taken was not justified by the return.
Weekly review checklist:
- Pull all trades from the past week into the journal.
- Calculate the rule adherence score (compliant trades ÷ total trades).
- Check drawdown trajectory — is it accelerating or stable?
- For any rule breach, tag the root cause (behavioral, operational, market condition).
- Compare planned risk vs actual risk for each trade; flag outliers.
- Review slippage and execution quality metrics.
- If drawdown is elevated, run a Monte Carlo simulation on the last 200+ trades to assess ruin probability before continuing at current size.
- Set parameters for the coming week based on findings.
Weekly after-action reviews with bias trackers and compliance scoring are the most reliable way to catch parameter drift before it becomes a drawdown problem. Keep the review session separate from trading hours — analysis and execution should never share the same mental state.
What platform features actually enforce the workflow?
Prioritize features that make rules non-optional. A rule you can override under pressure is not a rule — it is a suggestion.
Feature overview:
- OCO orders: attach stop and target simultaneously; one fill cancels the other. Eliminates the risk of a forgotten stop. Minor limitation: not all brokers guarantee the stop leg during gaps.
- Guaranteed stop-loss products: available on some CFD and spread-betting platforms; the broker guarantees the stop price regardless of gaps. Carries a premium, but eliminates gap risk on overnight positions.
- Position-sizing calculators: translate risk % and stop distance into units instantly. Removes arithmetic errors during fast markets.
- Correlation/exposure dashboards: show total portfolio heat across all open positions, adjusted for correlation. Critical for crypto traders running multiple altcoin positions simultaneously. Tools for monitoring digital asset market risk can surface concentration risk that per-trade rules miss.
- Pre-trade automated checks: some platforms allow conditional order logic that blocks an order if daily P&L is below a threshold.
- Automated lockouts: halt trading when the daily cap or kill-switch is breached, without requiring the trader to act.
- Journaling integrations: auto-import trade data for review; reduce manual logging errors.
Automation vs manual judgment. Automation is most valuable for execution tasks where emotion is a liability: placing stops, enforcing lockouts, sizing positions. Manual judgment should remain in the analysis and review layers — deciding what to trade, why the setup is valid, and what the weekly review means for next week’s parameters. Replacing analysis with automation produces mechanical execution of a strategy that was never properly evaluated.
Darkbot’s approach fits this division cleanly. The platform handles automated risk rule enforcement — API-connected order execution, stop placement, and exposure tracking — while the trader retains control over strategy design, parameter selection, and the review process. That separation is the correct architecture for systematic trading.
What behavioral mistakes break risk workflows, and how do you fix them?
The most damaging mistakes are not analytical errors. They are behavioral ones that occur after the analysis is done.
- Moving stops wider: the trade is losing and the stop feels “too close.” Fix: automate the stop at entry so it cannot be moved without a deliberate platform action that creates a journal record.
- Averaging down: adding to a losing position to reduce the average entry price. Fix: pre-commit in writing that averaging down is prohibited; configure the platform to reject additional entries in the same direction when the position is in loss.
- Ignoring correlation: running three crypto positions that all correlate with Bitcoin and treating them as independent 1% risks. Fix: run the correlation check on the pre-trade checklist before every entry.
- Failing to enforce daily limits: the cap is hit but trading continues “just one more.” Fix: automated lockout that requires a platform restart or a cooling-off period to override.
- Trading during high-emotion states: after a loss streak, after a large win, or during personal stress. Fix: mandatory 15-minute cooling-off timer after any trade that hits the stop; journal tag for emotional state at entry.
- Poor execution monitoring: never checking whether fills matched planned prices. Fix: add slippage to the weekly review as a tracked metric.
Pro Tip: Build a bias-tracking column into your trading journal. Tag each trade with the emotional state at entry (neutral, frustrated, overconfident, FOMO). After four weeks, the pattern of which state produces the most rule breaches is usually obvious — and that pattern is where the behavioral work needs to happen.
Automation is the most reliable enforcement mechanism for hard protective rules. A lockout that executes without asking for confirmation removes the option to rationalize an override in the moment.
How do you implement this workflow in 30 to 90 days?
Follow this step plan to embed the workflow, test it under real conditions, and scale only when the compliance data supports it.
Days 1–30: Foundation
- Define your numeric rules: risk % per trade, daily cap, kill-switch level. Write them down.
- Build the position-size spreadsheet and the order-entry template.
- Set up the trading journal with the metric columns from the table above.
- Run paper trading or minimum live size for four weeks. The goal is compliance data, not profit.
- Complete a weekly review at the end of each week.
Go/no-go check at Day 30:
- Rule adherence score ≥ 80%
- No kill-switch breach
- Planned vs actual risk gap < 0.3% per trade on average
Days 31–60: Automation and refinement
- Add automation elements: OCO orders, automated stop placement, platform alerts at 80% of daily cap.
- Refine stop placement method based on the first 30 days of data (were stops too tight? Too wide?).
- Continue weekly reviews; add bias-tracking tags.
- If drawdown occurred, run a Monte Carlo simulation on the trade log before increasing size.
Days 61–90: Scaling decision
- Review 200+ trades (live or paper) for expectancy and profit factor.
- Check return-to-drawdown ratio — target above 1.0.
- Confirm rule adherence score has held above 80% for at least six consecutive weeks.
Go/no-go check at Day 90:
- Expectancy positive across the full sample
- Return-to-drawdown ratio > 1.0
- No unresolved behavioral breach tags in the last four weeks
- Compliance score ≥ 85%
Only increase position size after all four conditions are met. Scaling before the compliance data supports it is the most common way traders undo months of disciplined work.
Key Takeaways
A disciplined, four-layer risk management workflow — position sizing, stop placement, daily/drawdown limits, and weekly review — is the structural foundation that keeps traders solvent through losing streaks and positions them to compound gains over time.
| Point | Details |
|---|---|
| Four-layer workflow | Position sizing, stop placement, daily/drawdown limits, and weekly review form the complete defensive system. |
| Numeric defaults | Start with 1–2% risk per trade, a 3% daily cap, and an 8–12% kill-switch drawdown halt. |
| Pre-trade checklist | Run five checks before every order: entry, stop, size, daily headroom, and event risk confirmed. |
| Weekly review | Track rule adherence score, return-to-drawdown ratio, and slippage every week to catch drift early. |
| Darkbot automation | Darkbot enforces API-connected stops, exposure tracking, and lockouts so protective rules execute without manual override. |
Why discipline-first rules are the only durable edge
Pre-declared rules protect edge and time-in-market. That is the short version. The longer version is that most trading losses are not caused by bad analysis — they are caused by good analysis followed by bad execution under emotional pressure.
The behavioral evidence is consistent: traders who allow manual override of hard protective rules regularly destroy their edge. The “it will come back” belief is not irrational in isolation — markets do mean-revert. The problem is that it is applied selectively, after losses, when the emotional cost of accepting a loss is highest. A workflow that was designed in a calm, pre-session state is a better decision-maker than the same trader in a live drawdown.
The four-layer framework in this article is not a novel invention. It is a formalization of what systematic traders have used for decades, adapted for the specific risks of modern markets — including crypto’s gap risk, correlation cascades, and exchange operational failures. The value is not in any individual rule but in the combination: each layer catches what the layer above it misses.
One practical note on automation: it does not replace judgment, and it should not try to. The analysis layer — deciding which setups to take and why — remains a human function. What automation does is remove the option to make a different decision at the worst possible moment. That is a narrow but decisive contribution.
How Darkbot enforces the workflow so rules stay non-optional
Automation’s primary value for risk control is deterministic execution. A rule that runs on code does not negotiate with itself at 2 AM during a volatile session.

Darkbot is an AI-based crypto trading automation platform built around systematic execution and structured risk control. Its architecture connects to major exchanges via API, executes pre-configured entry and exit rules, enforces stop placement without manual intervention, and tracks exposure across simultaneous positions in real time. For traders who have designed a workflow but struggle to enforce it consistently, that gap between plan and execution is exactly what the platform addresses.
When evaluating any automation vendor for risk workflow enforcement, require these features before committing:
- API order enforcement with stop placement at entry
- OCO order support
- Automated daily loss lockouts
- Audit logs for every order and parameter change
- Real-time exposure dashboard showing portfolio heat
- Backtesting and paper trading environment for pre-live validation
- Journaling or analytics integration for the weekly review
Test any vendor in paper-trade mode for at least two weeks before going live. Specifically, verify that the lockout mechanism triggers correctly when the daily cap is breached and that stop orders execute at the configured price under normal conditions. Behavior in paper trading is the closest proxy for live behavior you will get before real capital is at risk.
Darkbot’s free tier provides a starting point for that validation. The full platform includes backtesting, paper trading, and multi-exchange support — the infrastructure for testing the workflow before scaling it.
Useful sources and further reading
These are the most authoritative follow-ups for rules, stress-testing methods, and practitioner frameworks used in this article.
- SEC — Investor.gov: foundational guidance on capital preservation, leverage, and investor protection rules applicable to U.S. traders.
- CFTC — cftc.gov: regulatory framework for futures and derivatives trading in the U.S., including margin and leverage rules.
- FibAlgo — Dynamic Risk Management Plan Template: practitioner-level template covering volatility-adjusted sizing, correlation factors, and multi-timeframe stop architecture.
- ForexMechanics — Trader Workflow Guide: detailed breakdown of pre-session, execution, and post-session workflow separation with execution-quality audit guidance.
- ForexMechanics — Risk Management Plan Template: printable template with explicit thresholds for daily, weekly, monthly, and kill-switch limits.
- Finaur — Trading Risk Management Framework: covers the cascading limit system (1–2% per trade, 3% daily, 8–12% kill-switch) with practitioner commentary.
- Trading Risk Lab: browser-based suite of position-sizing calculators, Monte Carlo risk-of-ruin simulator, and trade journal analytics — useful for stress-testing the workflow numerically.
- Pipcy — Risk Management in Trading: clear taxonomy of risk types (market, volatility, liquidity, leverage, gap, systemic) with defense strategies for each.
- QuantInsti — Trading Risk Management: technical overview including Python-based stop-loss and take-profit implementation for systematic traders.
Recommended

Start trading on Darkbot with ease
Come and explore our crypto trading platform by connecting your free account!
Free plan available • No credit card required