Crypto Market Cycles: Their Role in Investing (2026)

TL;DR:
- Crypto market cycles follow recurring phases driven by supply, investor psychology, and macro trends. Recognizing these patterns helps investors manage risk better and improves long-term returns. Combining on-chain data, macro signals, and automation optimizes cycle-based investing strategies.
Crypto market cycles are recurring patterns of expansion and contraction that shape nearly every meaningful investment decision in digital assets. Understanding them isn’t a speculative edge — it’s a structural requirement for managing risk across a market where peak-to-trough drawdowns routinely exceed 70%. A cycle-aware approach has historically cut maximum drawdown from -80% to -44% over 15 years while improving the Sharpe ratio from 0.82 to 1.22 versus a simple buy-and-hold strategy. Both individual traders and institutional allocators use cycle signals not to predict exact tops and bottoms, but to adjust exposure systematically as market regimes shift. The practical implication: combining on-chain data, macro liquidity signals, and behavioral indicators produces a more durable framework than calendar-based timing alone.
What are crypto and Bitcoin market cycles?
Bitcoin price has moved in approximately 4-year cycles, each defined by a bull market peak followed by a prolonged bear phase. These cycles aren’t perfectly uniform, but their structure is consistent enough to serve as a planning framework.
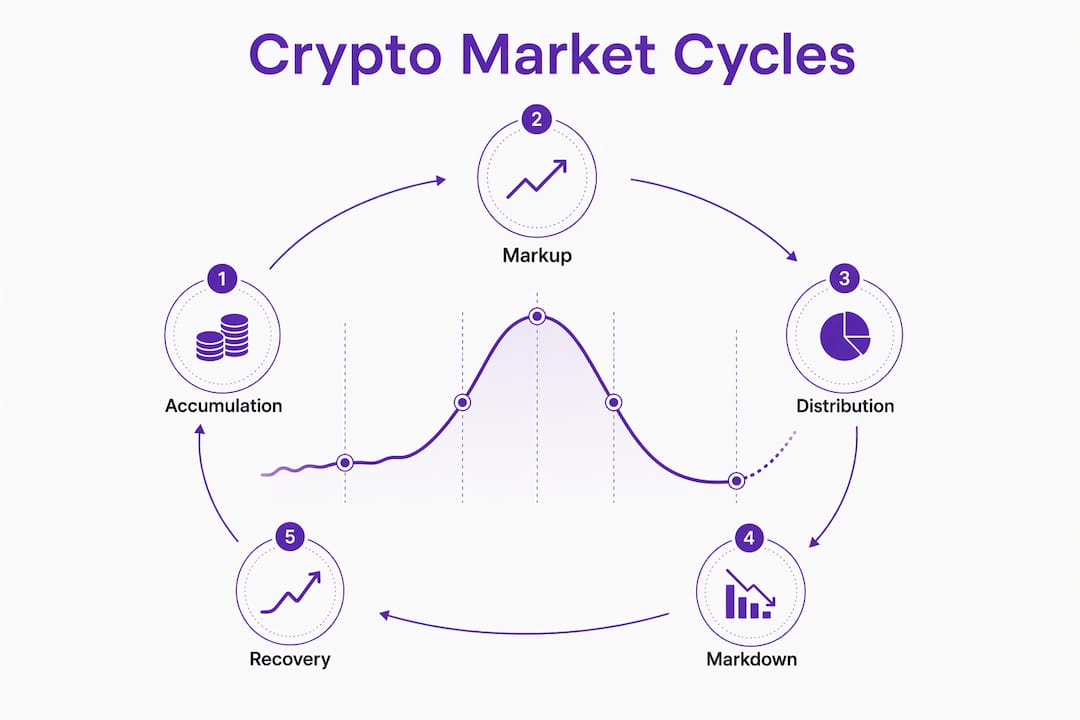
Each cycle passes through four recognizable phases:
- Accumulation: Price stabilizes near cycle lows. Volume is low, sentiment is negative, and long-term holders quietly build positions.
- Markup: Buying pressure increases, price trends upward, and new participants enter the market. Media coverage grows.
- Distribution: Price reaches elevated levels. Early buyers reduce exposure while late entrants push prices to cycle highs.
- Markdown: Selling accelerates, leverage unwinds, and price declines sharply toward the next accumulation zone.
Bitcoin’s cycle history illustrates the pattern clearly. Bull market tops occurred in November 2013 ($1,150), December 2017 ($19,800), and November 2021 ($69,000). Bear market lows followed in January 2015 ($152), December 2018 ($3,200), and November 2022 ($15,500).
Because Bitcoin represents the largest share of total crypto market capitalization, its cycle phase tends to lead the broader market. Altcoins typically amplify Bitcoin’s moves, rallying harder during markup and falling more sharply during markdown. Identifying where Bitcoin sits in its cycle is therefore the starting point for any broader crypto allocation decision.

Key on-chain indicators help locate the current phase. The MVRV ratio (market value to realized value) compares current price to the average cost basis of all coins. Past cycles saw MVRV peaks above 4. A reading of 2.6 in the current cycle suggests the bull phase may have room to continue. Altcoin perpetual futures open interest reaching $54 billion before major liquidations has historically signaled late-cycle speculative excess.
Why do crypto market cycles occur?
No single mechanism drives crypto cycles. They emerge from the interaction of supply constraints, investor psychology, and macroeconomic conditions.
Supply mechanics are the most structurally unique factor. Bitcoin’s halving events reduce the rate of new supply roughly every four years, creating a predictable supply shock. When demand holds steady or grows, reduced issuance tends to support price appreciation in the months that follow a halving.
Behavioral dynamics amplify the supply effect. Investor optimism compounds during markup phases as rising prices attract new buyers, which pushes prices higher still. The same feedback loop runs in reverse during markdown: fear and forced liquidations accelerate declines beyond what fundamentals alone would justify. This boom-bust pattern is well-documented in behavioral finance and is particularly pronounced in crypto because the asset class has a higher proportion of retail participants relative to traditional markets.
Macro and monetary policy add a third layer. Research from the IMF found that the crypto cycle is remarkably synchronized with global equity markets and reacts similarly to monetary policy shocks. A Federal Reserve tightening cycle raises the cost of capital, reduces risk appetite, and causes leveraged crypto investors to deleverage. The reverse holds during easing cycles. This connection has grown stronger since 2020 as institutional participation increased.
Global liquidity dynamics and regulatory clarity can override simple cycle timing entirely. Q2 2026 saw liquidity migration, ETF outflows, and macro risk factors compress crypto prices despite the cycle phase suggesting continued strength. Cycles set the backdrop; macro conditions determine the near-term path.
Pro Tip: Track the Federal Reserve’s rate trajectory alongside on-chain cycle indicators. When both signal the same direction, conviction in a cycle-based allocation decision is higher. When they diverge, reduce position size and widen your risk parameters.
How investors apply cycle knowledge to their strategies
Cycle awareness changes how you size positions, not just when you buy or sell, a strategy detailed in this Guía de investigación de fondos cripto. The practical application is regime-based allocation rather than binary all-in or all-out decisions.

Institutional investors use dynamic allocation bands adjusted by regime-level indicators. During confirmed bull phases, exposure increases toward the upper band. During bear regimes, it contracts toward the lower band. The key distinction from market timing is that these adjustments are gradual and rules-based, not reactive to daily price moves.
Contrasting approaches:
- Buy-and-hold: Simple to execute, but exposes the portfolio to full drawdowns. An investor who held Bitcoin through the 2021 peak to the 2022 low absorbed a drawdown exceeding 77%.
- Dollar-cost averaging (DCA): Reduces entry-price risk but doesn’t adjust for regime. DCA into a late-cycle distribution phase still results in a large unrealized loss before recovery.
- Cycle-aware allocation: Adjusts exposure based on confirmed regime signals (MVRV, funding rates, macro liquidity). Accepts lower upside during uncertain phases in exchange for reduced drawdown.
Disciplined execution is where most investors fail. Watching a bull market run while underweight is psychologically difficult. Watching a bear market deepen while holding a full position is worse. Rules-based systems remove the decision from the emotional moment. Automated trading systems can monitor multiple regime signals simultaneously and execute allocation adjustments without the hesitation that manual processes introduce.
Pro Tip: Set predefined allocation bands before a cycle begins, not during it. Deciding your bear-market floor and bull-market ceiling in advance removes the pressure of making those calls under stress.
Liquidity metrics matter alongside price signals. Stablecoin supply growth, ETF inflows and outflows, and funding rates on perpetual futures all provide real-time reads on market regime that price alone doesn’t capture. Automated portfolio management tools that integrate these signals can systematically track regime shifts and adjust allocations without requiring constant manual oversight.
How Bitcoin halving events shape crypto cycles
Bitcoin’s halving schedule is the most structurally predictable element of the crypto cycle. Every 210,000 blocks (roughly four years), the block reward paid to miners is cut in half. This reduces the rate at which new Bitcoin enters circulation, creating a supply-side constraint that has historically preceded bull market phases.
| Halving event | Approximate date | Block reward after halving | Subsequent bull market peak |
|---|---|---|---|
| First halving | — | — | — |
| Second halving | — | — | — |
| Third halving | May 2020 | 6.— | — |
| Fourth halving | April 2024 | — | Cycle ongoing as of 2026 |
| Fifth halving | Projected 2028 | — | Not yet occurred |
The next halving is projected for 2028, continuing the pattern of reduced supply inflation. Past halvings have correlated with bullish market phases in the 12–18 months that followed, though the timing and magnitude have varied across each cycle.
Two important caveats apply. First, the halving’s price effect is partially anticipated by the market in advance, which means the immediate post-halving reaction is often muted. Second, the supply reduction only matters if demand holds or grows. If macro conditions deteriorate sharply around a halving, the supply shock alone won’t produce a bull market. The 2020 halving occurred during a global liquidity crisis, yet the subsequent bull run was the strongest on record, driven by extraordinary monetary stimulus rather than the halving alone.
Historical crypto cycles and their impact on investment outcomes
Each completed cycle offers a different lesson about how cycle phase interacts with external conditions.
The 2013 cycle was driven almost entirely by retail speculation and early exchange infrastructure. Bitcoin rose significantly over roughly 11 months, then fell sharply over the following two years. Investors who bought near the peak waited until late 2017 to recover their nominal investment. The lesson: cycle peaks are identifiable in hindsight by extreme sentiment and parabolic price action, but nearly impossible to time precisely in real time.
The 2017–2018 cycle introduced the ICO boom, where thousands of altcoins launched on speculative narratives with little underlying utility. Bitcoin peaked in December 2017, and the broader altcoin market amplified both the upside and the subsequent collapse. The bear market low in December 2018 represented a large decline from peak. Investors who held diversified altcoin portfolios through the markdown phase often saw losses exceeding 95%.
The 2020–2022 cycle was the first to involve meaningful institutional participation. Corporate treasury allocations, futures ETF approvals, and the entry of macro hedge funds changed the character of the cycle. Bitcoin reached a cycle peak in late 2021 before falling substantially by late 2022. The collapse of the Terra/Luna ecosystem in May 2022 accelerated the markdown phase, wiping out tens of billions in market capitalization within days and triggering contagion across lending platforms.
The current cycle (2024 onward) began with the approval of spot Bitcoin ETFs in the United States in January 2024, which opened direct institutional access to Bitcoin exposure. The fourth halving occurred in April 2024. As of 2026, the cycle remains active, with on-chain indicators suggesting the bull phase has not yet reached the distribution characteristics seen at prior peaks.
How crypto cycles compare to traditional financial market cycles
Crypto cycles share structural similarities with equity and commodity cycles, but differ in ways that matter for portfolio construction.
Traditional equity markets follow business cycles driven by corporate earnings, interest rates, and GDP growth. These cycles typically span 5–10 years from trough to trough, with bear markets averaging a 30–40% peak-to-trough decline in major indexes. Crypto cycles are shorter (roughly 4 years) and far more volatile, with bear market drawdowns routinely exceeding 75–80% from peak.
The correlation between crypto and equities has increased substantially since 2020. IMF research found that a single crypto factor explains 80% of the variation in crypto prices, and this factor has become more correlated with the global financial cycle, particularly with technology and small-cap stocks. This means crypto no longer behaves as a fully independent asset class during macro stress events. When equity markets sell off sharply, crypto tends to sell off harder.
Commodity cycles offer a closer structural parallel. Like Bitcoin, commodities respond to supply constraints and demand cycles, and their prices can be influenced by a single dominant supply event (an OPEC production cut, a mining disruption). Bitcoin’s halving functions similarly to a programmed supply cut, making the commodity cycle framework more applicable than the equity cycle framework in some respects.
The key practical difference for investors is the speed of crypto cycles. A full equity cycle might give an investor years to recognize a regime shift and adjust. A crypto cycle can move from accumulation to distribution in 12–18 months. That speed requires either more frequent monitoring or a systematic, rules-based approach to managing cycle risk that doesn’t depend on manual observation.
Crypto also lacks the institutional stabilizers present in equity markets. Circuit breakers, margin requirements enforced by regulated exchanges, and central bank intervention all slow equity market declines. Crypto markets operate 24 hours a day, seven days a week, with fewer structural brakes on momentum. This amplifies both the upside during markup and the downside during markdown.
Darkbot is built for exactly this environment. Its AI-driven automation monitors regime signals continuously, executes allocation adjustments according to predefined rules, and removes the emotional friction that causes most investors to act too late in a cycle. Whether you’re managing a personal portfolio or running a systematic strategy across multiple exchanges, Darkbot’s trading automation applies consistent, rule-based logic at every phase of the cycle.

Key takeaways
Cycle-aware investing in crypto consistently outperforms passive buy-and-hold by reducing maximum drawdown and improving risk-adjusted returns across full market cycles.
| Point | Details |
|---|---|
| Cycles follow four phases | Accumulation, markup, distribution, and markdown repeat across roughly 4-year intervals tied to Bitcoin’s halving schedule. |
| Drawdown reduction matters | A cycle-aware approach cut maximum drawdown from -80% to -44% over 15 years compared to buy-and-hold. |
| Halvings set the structure | Bitcoin’s supply reductions in 2020 and 2024 each preceded a bull market phase, though timing and magnitude varied. |
| Macro conditions override timing | Global liquidity, Fed policy, and ETF flows can accelerate or delay cycle phases regardless of where the halving calendar points. |
| Automation reduces execution error | Rules-based systems remove emotional decision-making, which is the primary source of underperformance in cycle-based strategies. |
Recommended

Start trading on Darkbot with ease
Come and explore our crypto trading platform by connecting your free account!
Free plan available • No credit card required