Trading Bot Backtest Results: A Crypto Trader's Guide

TL;DR:
- A trading bot backtest generates performance metrics by simulating a rule-based strategy on historical data to estimate potential effectiveness.
- While useful, backtest results depend on realistic methodology and are not guarantees of future success.
A trading bot backtest result is the set of performance statistics generated by simulating a fully rule-based trading strategy against historical market data to estimate its potential edge before live deployment. These statistics include net profit, maximum drawdown, Sharpe ratio, win rate, and profit factor. Backtesting is the third phase of the Algorithm Development Lifecycle, serving as the evidence-generation step that determines whether a strategy justifies real capital allocation. A valid backtest requires at least 12 months of historical OHLCV data and must account for trading fees and slippage assumptions to produce meaningful results.
What is a trading bot backtest result made of?
A backtest result is not a single number. It is a structured report of multiple performance metrics, each measuring a different dimension of strategy quality.
The most widely used metrics are:
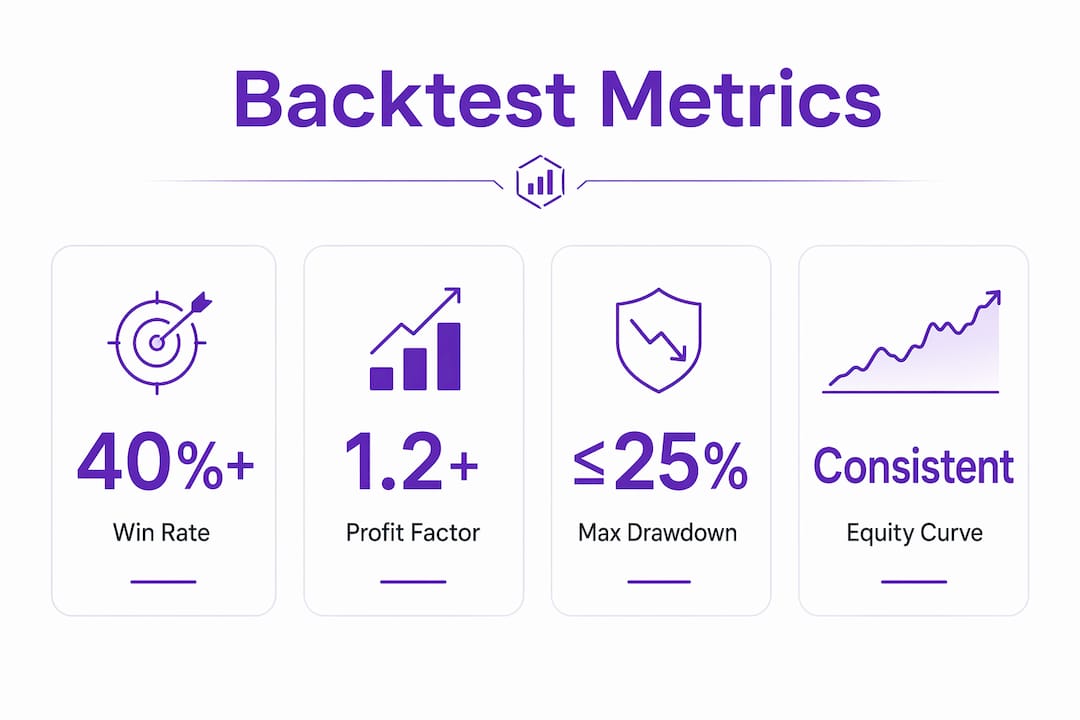
- Win rate: The percentage of trades that close in profit. A win rate of 40% or higher is a standard minimum threshold for most systematic strategies.
- Profit factor: Total gross profit divided by total gross loss. A profit factor of 1.2 or above indicates the strategy earns more than it loses over the test period.
- Maximum drawdown: The largest peak-to-trough decline in the equity curve. Professionals treat a maximum drawdown above 25% as a warning sign for capital preservation.
- Sharpe ratio: Risk-adjusted return per unit of volatility. A Sharpe ratio of 0.5 or higher is a common baseline, while institutional-grade bots often target above 3.0.
- Total trade count: The number of simulated trades. Fewer than 100 trades produces statistically unreliable conclusions.
Net profit alone is a shallow metric. A strategy that returns 80% with a 60% drawdown is far more dangerous than one returning 30% with a 10% drawdown. Risk-adjusted returns like the Sharpe and Sortino ratios capture this distinction where raw ROI cannot.
Pro Tip: Examine the equity curve shape, not just the final return. A smooth, upward-sloping curve signals consistent performance. A jagged curve with long flat periods followed by sharp spikes suggests the strategy depends on a small number of lucky trades.

| Metric | Minimum threshold | What it measures |
|---|---|---|
| Win rate | ≥40% | Percentage of profitable trades |
| Profit factor | ≥1.2 | Gross profit divided by gross loss |
| Maximum drawdown | ≤25% | Largest equity decline from peak |
| Sharpe ratio | ≥0.5 | Return per unit of volatility |
| Trade count | ≥100 | Statistical sample reliability |
How is a backtest conducted to produce valid results?
Methodology determines whether a backtest result is trustworthy or misleading. A poorly designed simulation can show perfect results that collapse the moment the bot goes live.
A reliable backtesting process follows these steps:
- Use an event-driven engine. Event-driven backtesters process market data in strict chronological order, one event at a time. This mirrors how a live bot actually receives and acts on data.
- Enforce chronological order to prevent look-ahead bias. Look-ahead bias occurs when the simulation uses future price data to make a past decision. It produces unrealistically perfect results that cannot be replicated in live trading.
- Model realistic execution conditions. Slippage, partial fills, order rejection, and timing delays all affect real trades. Simulating exchange-specific conditions such as mid-fill crashes and latency is necessary for accurate results.
- Apply actual fee structures. Every trade incurs maker or taker fees. Ignoring fees inflates net profit and distorts the profit factor.
- Use at least 12 months of quality OHLCV data. Shorter periods may not capture full market cycles, including bull runs, bear markets, and sideways consolidation phases.
- Run walk-forward analysis and Monte Carlo simulations. Walk-forward analysis uses rolling out-of-sample data to test whether the strategy holds up beyond the training period. Monte Carlo simulations apply random variations to trade sequences to stress-test robustness.
Pro Tip: Always reserve at least 20% of your historical data as an out-of-sample test set. Never optimize parameters on this reserved data. It is your only unbiased measure of how the strategy performs on data it has never seen.
The quality of the simulation environment matters as much as the strategy logic itself. Sophisticated engines simulate order book events and fill latency at millisecond granularity to reflect true execution possibilities.

What are the common limitations of backtest results?
Backtest results are evidence, not guarantees. Several structural gaps separate simulated performance from live trading outcomes.
- Market regime changes. Historical data reflects past conditions. A strategy optimized for a trending market may fail in a range-bound environment. Crypto markets shift regimes faster than most traditional asset classes.
- Overfitting and data snooping. A suspiciously high profit factor or win rate often signals overfitting. This happens when a strategy is tuned so precisely to historical data that it captures noise rather than a repeatable edge. Strategies passing minimum thresholds provide positive evidence but cannot guarantee live success.
- Slippage gaps. Even well-modeled slippage assumptions underestimate real-world impact during low-liquidity periods or sudden volatility spikes.
- Unmodeled operational risks. Exchange outages, API rate limits, and network latency are not captured in most backtests. These factors can prevent a bot from executing trades at the exact moment the strategy signals.
- Market impact. Large position sizes move the market. A backtest that ignores market impact overstates profitability for any strategy trading meaningful volume.
A backtest result that looks too good almost always is. Win rates above 80% or profit factors above 5.0 in crypto backtests typically indicate overfitting, not a genuine edge. Apply conservative thresholds and treat outlier results with skepticism before committing capital.
The practical implication is clear. Strong backtest metrics are necessary but not sufficient for live success. They confirm that a strategy has a historical edge under simulated conditions. They do not confirm that the edge will persist when real money, real execution, and real market dynamics are involved.
How to interpret backtest results to refine your strategy
Interpreting backtest results is a structured process, not a single pass-fail check. Traders who use results effectively treat them as a diagnostic tool for iterative refinement.
Start with risk-adjusted metrics rather than net profit. The Sortino ratio, which penalizes only downside volatility, is particularly useful for crypto strategies where upside volatility is desirable. A strategy with a lower total return but a higher Sortino ratio is often the more durable choice for crypto trading strategy optimization.
Apply minimum thresholds as pass-fail gates before any further analysis. The industry-standard minimums are a win rate of 40% or above, a profit factor of 1.2 or above, a maximum drawdown of 25% or below, and a Sharpe ratio of 0.5 or above across at least 100 trades. A strategy that fails any one of these gates requires revision before live deployment.
| Evaluation step | Method | Purpose |
|---|---|---|
| Initial screening | Apply minimum metric thresholds | Filter out clearly unviable strategies |
| Risk-adjusted review | Sharpe and Sortino ratio analysis | Assess return quality relative to risk |
| Robustness check | Walk-forward and Monte Carlo testing | Confirm results hold on unseen data |
| Regime stress test | Segment results by market condition | Identify where the strategy breaks down |
| Qualitative review | Assess strategy logic and assumptions | Catch structural flaws metrics cannot reveal |
Segment your backtest results by market regime. Run the same strategy against data from a bull market period, a bear market period, and a sideways consolidation period separately. A strategy that performs well across all three regimes is more likely to survive live conditions than one that excels only in trending markets.
Pro Tip: Parameter optimization should be done on in-sample data only. If you adjust parameters after seeing out-of-sample results, those results are no longer unbiased. The walk-forward process must remain strictly sequential to preserve its validity.
Qualitative assessment complements quantitative metrics. A strategy with solid numbers but flawed logic, such as one that relies on an arbitrage opportunity that no longer exists, will fail regardless of what the backtest shows. Always verify that the strategy’s underlying reasoning is still valid in current market conditions. Resources like building a reliable trading strategy outline how industry standards apply to this validation process.
Key takeaways
A trading bot backtest result is a diagnostic report, not a performance promise. Its value depends entirely on the quality of the simulation methodology and the discipline applied when interpreting the output.
| Point | Details |
|---|---|
| Core definition | A backtest result is a set of statistical metrics from simulating a rule-based strategy on historical data. |
| Minimum data standard | Use at least 12 months of OHLCV data to capture multiple market regimes. |
| Critical metrics | Win rate, profit factor, max drawdown, and Sharpe ratio each measure a distinct risk dimension. |
| Methodology integrity | Event-driven engines with strict chronological order prevent look-ahead bias and inflated results. |
| Interpretation discipline | Strong backtest metrics are necessary but not sufficient. Always validate with out-of-sample testing. |
Backtesting tells you less than you think, and more than you realize
By Grisha
After years of working with automated crypto strategies, I have seen traders make two opposite mistakes with backtest results. The first group dismisses them entirely, calling backtests “just history.” The second group treats a strong backtest as a green light to deploy capital without further scrutiny. Both approaches are wrong.
The real value of a backtest is not the final return figure. It is the shape of the equity curve, the behavior during drawdown periods, and how the strategy responds to regime changes within the historical data. A strategy that recovers quickly from drawdowns and maintains a consistent win rate across different market conditions tells you something meaningful. A strategy that shows a single explosive run followed by flat performance tells you almost nothing useful.
My experience is that most live trading failures trace back to execution realities, not strategy logic. The backtest looked fine. The live bot encountered slippage, API delays, or a liquidity gap that the simulation never modeled. This is why I place more weight on the realism of the simulation environment than on the metrics themselves. A mediocre result from a rigorous simulation is more informative than a perfect result from a shallow one.
Platforms like Darkbot apply AI-driven consistency to systematic execution, which helps reduce the gap between simulated and live performance. But no platform eliminates that gap entirely. Treat backtests as a necessary filter, not a final answer. Continuous monitoring and iterative refinement after live deployment are what actually build durable strategies.
— Grisha
Darkbot and systematic backtest-driven trading
Darkbot provides a backtesting environment built for cryptocurrency traders who need realistic, data-grounded strategy evaluation. The platform connects to multi-exchange historical data and applies execution-realistic simulations that account for slippage, fees, and order conditions. Risk-adjusted analytics including Sharpe and Sortino ratios are built into the performance reporting, so traders can evaluate strategy quality beyond simple return figures.
For traders who want to move from backtest analysis to live execution without rebuilding their workflow, Darkbot’s automated trading platform integrates strategy validation directly with live bot deployment. The backtesting module supports parameter optimization and walk-forward validation within a single environment, reducing the friction between testing and execution.
FAQ
What is a trading bot backtest result?
A trading bot backtest result is a set of statistical metrics produced by simulating a rule-based trading strategy on historical market data. It includes metrics like win rate, profit factor, maximum drawdown, and Sharpe ratio to estimate a strategy’s potential edge.
How much historical data is needed for a valid backtest?
A minimum of 12 months of historical OHLCV data is the standard requirement for meaningful backtest results. Shorter periods risk missing full market cycles and produce statistically unreliable conclusions.
What is look-ahead bias in backtesting?
Look-ahead bias occurs when a backtesting simulation uses future price data to make past trading decisions, producing unrealistically strong results. Event-driven engines that process data in strict chronological order prevent this error.
What minimum thresholds should a backtest result meet?
Industry-standard minimums are a win rate of 40% or above, a profit factor of 1.2 or above, a maximum drawdown of 25% or below, and a Sharpe ratio of 0.5 or above across at least 100 trades. Strategies that fail any one threshold require revision before live deployment.
Why do strong backtest results sometimes fail in live trading?
Strong backtest results fail in live trading due to market regime changes, unmodeled slippage, exchange operational risks, and overfitting to historical data. Backtest results confirm a historical edge under simulated conditions but cannot guarantee that edge persists in live markets.
Recommended

Start trading on Darkbot with ease
Come and explore our crypto trading platform by connecting your free account!
Free plan available • No credit card required