How to Backtest Crypto Strategies That Hold Up in Live Markets

Backtesting crypto strategies means replaying exact entry, exit, and position-sizing rules against historical OHLCV (or higher-resolution) data under realistic execution assumptions — fees, slippage, and funding included. The goal is not to find the highest backtest return. It is to measure whether a rule-based edge is repeatable enough to risk capital on.
The fastest reliable workflow, in order:
- Define exact rules (signal, confirmation, timeframe, asset, entry/exit, stop/take-profit, sizing)
- Source matched-resolution historical data (tick or 1m for scalping; 1h/daily for swing)
- Build a realistic execution model (OMS, order types, maker/taker fees, slippage, funding rates)
- Run in-sample optimization, then validate on a held-out out-of-sample period
- Run walk-forward analysis and permutation testing to check statistical robustness
- Paper trade for 4–12 weeks before committing real capital
Three anchors separate credible backtests from misleading ones: realistic cost modeling (fees, slippage, funding), walk-forward validation, and permutation testing. Darkbot provides an integrated pipeline that covers all three, from historical simulation through paper trading to live exchange deployment.
Key Takeaways
A credible backtest requires matched-resolution data, a realistic execution model with fees and slippage, out-of-sample validation, and walk-forward testing before any capital is committed.
| Point | Details |
|---|---|
| Match data to strategy | Use tick or 1m data for scalping; 1h or daily for swing strategies. |
| Model all costs | Include maker/taker fees, slippage, spread, and perpetual funding rates in every test. |
| Mandate OOS validation | Always hold out 20–30% of data and run walk-forward before treating results as credible. |
| Paper trade first | Run 4–12 weeks of paper trading and compare fill prices against backtest assumptions before going live. |
| Darkbot for deployment | Darkbot provides an integrated backtest-to-paper-to-live pipeline with built-in risk controls and exchange API management. |
What every credible crypto backtest must include
A backtest is only as trustworthy as its weakest input. Most failures trace back to one of three gaps: bad data, an incomplete execution model, or no out-of-sample validation.
Data layer
The data layer defines what your strategy actually sees. OHLCV bars (open, high, low, close, volume) are sufficient for most swing and position strategies. Intraday scalping strategies need 1m bars at minimum, and ideally tick or trade-level data to model realistic fill behavior. Free exchange APIs typically cover a limited recent history, which is rarely enough to span a full bull-bear-sideways cycle. Paid tick-level vendors fill that gap for multi-cycle testing.
Key data decisions:
- Exchange and symbol: BTC/USDT on Binance behaves differently from BTC/USD on Coinbase or Kraken. Quote currency matters for P&L calculations.
- Timeframe resolution: match the bar size to the strategy’s signal frequency. A 4h strategy tested on daily bars misses intrabar moves that would trigger stops.
- Data hygiene: check for duplicate timestamps, missing bars, timezone misalignments, and splits caused by exchange outages or token migrations.
Execution model
The order management system (OMS) simulates how orders actually fill. Bar-close fills are the simplest assumption and work for daily strategies. For anything faster, a simulated order-book fill with a slippage model is more honest. Position sizing rules — fixed percentage, Kelly fraction, inverse-volatility — belong here too, not as an afterthought.
Cost and friction model
This is where most amateur backtests fail. A realistic cost model includes:
- Maker and taker fees (Binance spot: 0.1% taker; perpetual funding rates vary by market conditions)
- Slippage, especially for small-cap tokens with thin order books
- Spread on entry and exit
- For perpetual contracts: funding rate cash flows, which can erode a long-biased strategy significantly over weeks
Validation modules
| Component | Why it matters | Minimal check |
|---|---|---|
| In-sample / out-of-sample split | Prevents fitting to noise | Hold out last 20–30% of data |
| Walk-forward runner | Tests parameter stability across time | Roll IS/OOS window forward in steps |
| Permutation testing | Checks if results beat random chance | Shuffle returns 500–1,000 times |
| Trade-level log | Audits every fill and P&L | Export CSV; verify manually on 10 trades |
How to run a rigorous backtest, step by step
Reproducibility is the standard. If someone else cannot replicate your result from your rules and data, the test is not finished.
-
Convert the idea into exact rules. Write down the signal (e.g., 20-period SMA crosses above 50-period SMA on the 1h chart), the confirmation condition if any, the asset (BTC/USDT), the entry trigger (bar close after crossover), the stop-loss (2 ATR below entry), the take-profit (4 ATR above entry), and the position size (1% of equity per trade). Ambiguity here propagates into every downstream result.
-
Source and validate data. Download OHLCV bars at the resolution your strategy requires. Check for gaps, duplicates, and timezone consistency. For multi-cycle testing, verify coverage spans at least one full bull and one full bear phase.
-
Implement the OMS and execution assumptions. Decide on bar-close fills versus simulated order-book fills. Set the slippage model (flat basis points or volume-weighted). Apply maker/taker fees on every fill. For perpetuals, apply funding rate cash flows at the correct 8-hour intervals.
-
Run in-sample optimization and log every trade. Limit parameter optimization to a small, justified grid. Export a trade-level CSV: entry time, exit time, price, size, fees, slippage, net P&L. This log is the audit trail.
-
Validate out-of-sample and with walk-forward. Apply the best in-sample parameters to the held-out period without touching them. Then run a rolling walk-forward to check whether performance degrades predictably or collapses. Run permutation testing to confirm the observed Sharpe is not a statistical accident.
-
Paper trade before committing capital. Run the strategy live on a paper account for 4–12 weeks, comparing fill prices, slippage, and latency against backtest assumptions.
Pro Tip: Always shift your signal by one bar before generating an order. If your crossover fires on bar N’s close, the order executes at bar N+1’s open — not at the same bar’s close. Skipping this shift is lookahead bias, and it inflates returns materially in most indicator-based strategies.
Which performance metrics matter, and which mislead you
Metrics worth reporting
A complete performance report covers: net return and CAGR, annualized volatility, Sharpe ratio, Sortino ratio, maximum drawdown, Calmar ratio (CAGR divided by max drawdown), profit factor, total trade count, average win and average loss, and longest consecutive losing streak.
The Sortino ratio often tells a cleaner story than Sharpe for crypto, because it penalizes only downside volatility. A strategy with a Sharpe of 1.2 and a Sortino of 2.1 is behaving very differently from one where both ratios are near 1.0.
Maximum drawdown deserves more weight than most traders give it.
Metrics that mislead
Raw return without drawdown context is the most common vanity metric. In-sample Sharpe without out-of-sample validation is equally unreliable: any parameter grid will produce a high Sharpe on the data it was optimized against.
Realistic cost modeling changes results more than most traders expect. Coin Bureau’s analysis notes that fees, slippage, and funding can substantially reduce apparent edge, particularly for high-frequency strategies where transaction costs compound across hundreds of trades per month. Run three cost scenarios — low, medium, and high friction — and report all three.
Minimum trade count matters. A strategy that generates 15 trades per year produces Sharpe and drawdown figures that are statistically unstable. Aim for at least 30–50 trades in the in-sample period before treating any metric as meaningful.
Common pitfalls in crypto backtesting and how to avoid them
Lookahead bias
This is the single most common source of inflated backtest returns. It occurs when a signal calculated on bar N is used to fill an order at bar N’s close, rather than bar N+1’s open. The fix is one line of code: shift the signal series by one bar before passing it to the order generator. Echo Zero’s Python guide documents this clearly and shows how easy it is to miss.
Survivorship and selection bias
A strategy that looks profitable on today’s top-50 tokens may have been tested on a cherry-picked universe. Include delisted tokens in your dataset where possible, and account for fork and airdrop events that create artificial price discontinuities.
Overfitting
Running a 20-parameter grid search and reporting the best result is not optimization — it is curve-fitting. The more parameters you tune, the more likely the best result reflects noise rather than signal. Walk-forward analysis and out-of-sample testing are the primary defenses. Prefer strategies with fewer parameters and larger performance margins.
Poor cost modeling
Modeling only taker fees and ignoring slippage, spread, and perpetual funding is a common shortcut that produces unrealistic results. For perpetual strategies, funding rates can swing from positive to negative and represent a real cash flow. Model them at the correct intervals.
Data hygiene failures
Duplicate index entries, missing bars around exchange outages, timezone mismatches between data sources, and quote-currency inconsistencies all corrupt results silently. A strategy that appears to trade BTC/USDT may actually be computing P&L against a BTC/USD price series if the data sources are mixed.
Pro Tip: Slippage modeling is not one-size-fits-all. For BTC and ETH on Binance or Coinbase, 2–5 basis points per side is a reasonable starting assumption for moderate position sizes. For small-cap tokens with daily volumes under $5M, realistic slippage can be 50–200 basis points or more per side — and that difference alone can flip a profitable strategy into a losing one.
From backtest to live: forward testing and deployment
A backtest that passes statistical validation is a hypothesis, not a deployment decision. The next step is forward testing under real market conditions.
Forward testing plan
Run the strategy on a paper account for 4–12 weeks, calibrated to the strategy’s trade frequency. A daily strategy needs at least 8–12 weeks to generate enough trades for meaningful comparison. Monitor slippage versus backtest assumptions, fill rates on limit orders, and latency between signal generation and order submission.
Deployment checklist
- Confirm API key permissions are scoped correctly (trade-only, no withdrawal access).
- Verify rate limits on the target exchange (Binance, Coinbase, Kraken) and add request throttling.
- Set a hard maximum drawdown stop at the account level — not just per-strategy.
- Implement a kill-switch that halts all orders if drawdown exceeds the threshold.
- Set maximum position size limits to prevent runaway sizing bugs.
- Configure monitoring and alerting for order failures, connectivity drops, and unexpected position states.
- Compare the first 30–90 live trades against the backtest trade log line by line. Systematic deviations signal a model mismatch that needs investigation before scaling.
Scale in gradually. Operational readiness — monitoring, kill-switch logic, API permission scoping — is frequently overlooked until the first live incident. Platforms that include these features as built-in defaults, rather than leaving them to the trader to implement from scratch, reduce deployment risk meaningfully.
For a detailed automated trading checklist covering the transition from backtest to live execution, Darkbot’s resource covers the operational steps in sequence.
Which tools and data sources should you use?
The right tool depends on whether you need speed, flexibility, or an end-to-end workflow.
Code-first libraries
Python is the dominant environment for research-grade backtesting, with a mature ecosystem covering data manipulation (pandas, numpy), statistical analysis (scipy, statsmodels), and visualization (matplotlib, plotly).
Within that ecosystem, two frameworks cover most use cases:
- vectorbt: vectorized execution runs thousands of parameter combinations far faster than event-driven approaches, making it the right choice for large grid searches and rapid iteration on OHLCV data. The tradeoff is that it abstracts away order-book mechanics, so execution realism is limited.
- Backtesting.py: event-driven, closer to how a live system processes orders bar by bar. Better for strategies where order sequencing, partial fills, or complex position management matter.
For indicator implementations, Tulip Indicators provides a vetted cross-language library that reduces implementation drift between your backtest and live execution environments — a subtle but real source of performance discrepancy.
For exchange-specific flows including OHLCV caching, OMS simulation, position managers, and permutation testing, open-source frameworks built around Binance’s API structure demonstrate the full feature set a production-grade backtest needs.
Data sources
Exchange REST APIs (Binance, Coinbase, Kraken) provide free OHLCV data but typically cover only 2–3 years at 1m resolution. For multi-cycle testing or tick-level data, paid vendors are necessary. For traders interested in alternative data, the Assymetrix API provides access to high-resolution prediction market price snapshots, which can complement traditional OHLCV feeds for certain strategy types.
For second-level replay and manual strategy refinement, FX Replay offers intraday replay at sub-minute resolution — useful for discretionary traders who want to test ideas manually before coding them up.
How Darkbot fits
Darkbot provides an integrated workflow that covers the full cycle: historical data caching, OMS simulation with realistic fee and slippage modeling, paper trading with exchange API parity, and live deployment to Binance, Coinbase, Kraken, and other major exchanges. For traders who want to move from a validated strategy to a running bot without building the operational infrastructure from scratch, that integration removes a significant amount of engineering work.
Pro Tip: Match data resolution to strategy timeframe before anything else. A scalping strategy needs tick or 1m data — testing it on 1h bars will produce results that bear no relationship to live performance. A swing strategy tested on 1m data wastes compute and introduces noise. Get the resolution right first, then worry about parameter choices.
Concrete example: backtesting a 20/50 SMA crossover on BTC/USDT
This example uses a simple moving average crossover to illustrate the full workflow with concrete settings.
Strategy definition
- Asset: BTC/USDT perpetual on Binance
- Timeframe: 1h bars
- Signal: 20-period SMA crosses above 50-period SMA (long entry); crosses below (exit long / short entry if shorting)
- Entry: bar close after confirmed crossover, shifted by one bar (bar N+1 open)
- Stop-loss: 2 ATR(14) below entry
- Take-profit: 4 ATR(14) above entry
- Position size: 1% of equity per trade (fixed fractional)
- Fees: 0.04% maker / 0.06% taker per side
- Slippage: 3 basis points per side
- Funding: applied at 8-hour intervals using historical funding rate data
Pseudocode outline
for each bar in data:
    sma_20 = rolling_mean(close, 20)
    sma_50 = rolling_mean(close, 50)
    signal = crossover(sma_20, sma_50)          # fires on bar N
    signal_shifted = signal.shift(1)             # execute on bar N+1
    atr = average_true_range(high, low, close, 14)

    if signal_shifted == LONG and no_position:
        size = equity * 0.01 / entry_price
        entry = open[current_bar] * (1 + slippage)
        stop = entry - 2 * atr
        tp   = entry + 4 * atr
        submit_order(BUY, size, entry, stop, tp)

    apply_fees(fill_price, size, taker_rate)
    apply_funding(position, funding_rate, interval)
Parameter grid and data split
- SMA fast: 10, 15, 20, 25
- SMA slow: 40, 50, 60, 70
- In-sample period: January 2020 through December 2022 (covers bull run, peak, and bear market)
- Out-of-sample period: January 2023 through December 2024 (recovery and consolidation phases)
Pro Tip: Always include at least one bear market phase in your in-sample period. A strategy optimized only on bull-market data will almost always fail the first time the market turns.
Expected outputs to inspect
- Trade-level CSV: every entry/exit with timestamp, price, size, fees, slippage, net P&L
- Equity curve: visual check for smooth growth versus jagged drawdown patterns
- Sharpe ratio (annualized), max drawdown, CAGR, and profit factor
- OOS Sharpe versus IS Sharpe: a ratio below 0.5 suggests overfitting
- Trade count: confirm at least 30–50 trades in each period for metric stability
A strategy that produces a Sharpe of 1.8 in-sample and 0.6 out-of-sample has not failed — it has told you exactly what you needed to know before risking capital. That information is the value of the backtest.
How to validate results with walk-forward and permutation testing
Statistical validation is what separates a tested edge from a well-fitted curve.
Walk-forward analysis
Walk-forward testing rolls a fixed in-sample window forward through time, re-optimizing parameters at each step and immediately testing on the next out-of-sample window. The result is a sequence of OOS performance periods that shows whether the strategy’s edge is stable or regime-dependent.
- Set the IS window to cover at least 2–3 full strategy cycles (for a daily strategy, 12–18 months minimum)
- Set the OOS window to 25–33% of the IS window length
- Watch for degradation patterns: gradual decay suggests regime drift; sudden collapse suggests overfitting to a specific market phase
Permutation testing
Permutation testing answers the question: could this performance have occurred by chance? The procedure is straightforward:
- Record the observed performance metric (e.g., Sharpe ratio = 1.4)
- Randomly shuffle the trade return sequence 500–1,000 times
- Compute the same metric on each shuffled sequence
- The p-value is the fraction of shuffled results that equal or exceed the observed metric
The LevRoz630 crypto-backtester demonstrates this approach in a Binance-specific open-source implementation.
Stability checks
- Parameter sensitivity heatmap: vary each parameter by ±20% and observe how Sharpe changes. A robust strategy shows gradual degradation, not a cliff edge.
- Bootstrap of trade sequences: resample trades with replacement to build a confidence interval around the Sharpe and max drawdown.
- Minimum trade count: below 30 trades per validation period, most metrics are statistically unreliable. A strategy with 12 trades per year needs several years of OOS data before conclusions are defensible.
For a deeper look at strategy optimization techniques and avoiding over-optimization, the Darkbot blog covers parameter sensitivity and walk-forward workflows in practical detail.
When to DIY your backtests versus using an integrated platform
The honest answer is that it depends on what you are actually trying to accomplish.
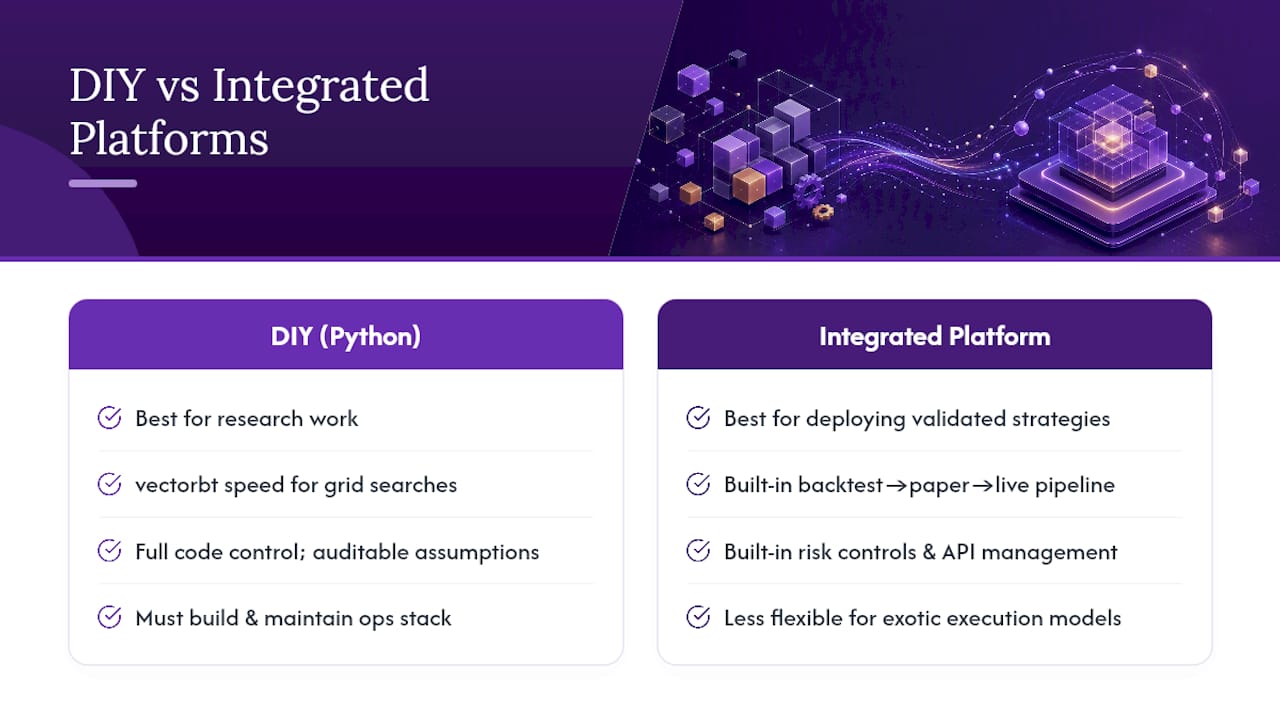
DIY with Python and vectorized frameworks makes sense when the work is research-oriented: testing novel signal combinations, running academic-style statistical analysis, or building a custom execution model that no platform supports. vectorbt’s speed advantage for large grid searches is real, and full code control means you can audit every assumption. The tradeoff is that the operational layer — data pipelines, OMS simulation, paper trading infrastructure, live deployment, monitoring — all needs to be built and maintained separately. That is a significant engineering commitment, and it is where most individual traders underestimate the time cost.
An integrated platform like Darkbot makes sense when the goal is to move a validated strategy into live execution without rebuilding the infrastructure stack. The backtest-to-paper-to-live pipeline, built-in risk controls, and exchange API management are already there. The tradeoff is less flexibility for exotic execution models or highly custom statistical work.
The vendor lock-in concern is real but often overstated. If the strategy logic is well-documented and the trade logs are exportable, moving between platforms is a defined engineering task, not a catastrophic dependency. What matters more is whether the platform’s execution model is transparent enough to trust — and whether the paper trading environment genuinely matches live exchange behavior.
For traders who are building toward algorithmic trading at scale, starting with a platform that handles the operational layer while you focus on strategy logic is often the faster path to a running system. The DIY route is worth it when the research itself is the product.
Darkbot supports the full backtest-to-live cycle
Skipping the operational layer is where most deployments go wrong. Darkbot is built specifically for traders who have validated a strategy and need a reliable path from backtest to live execution without building the infrastructure themselves.
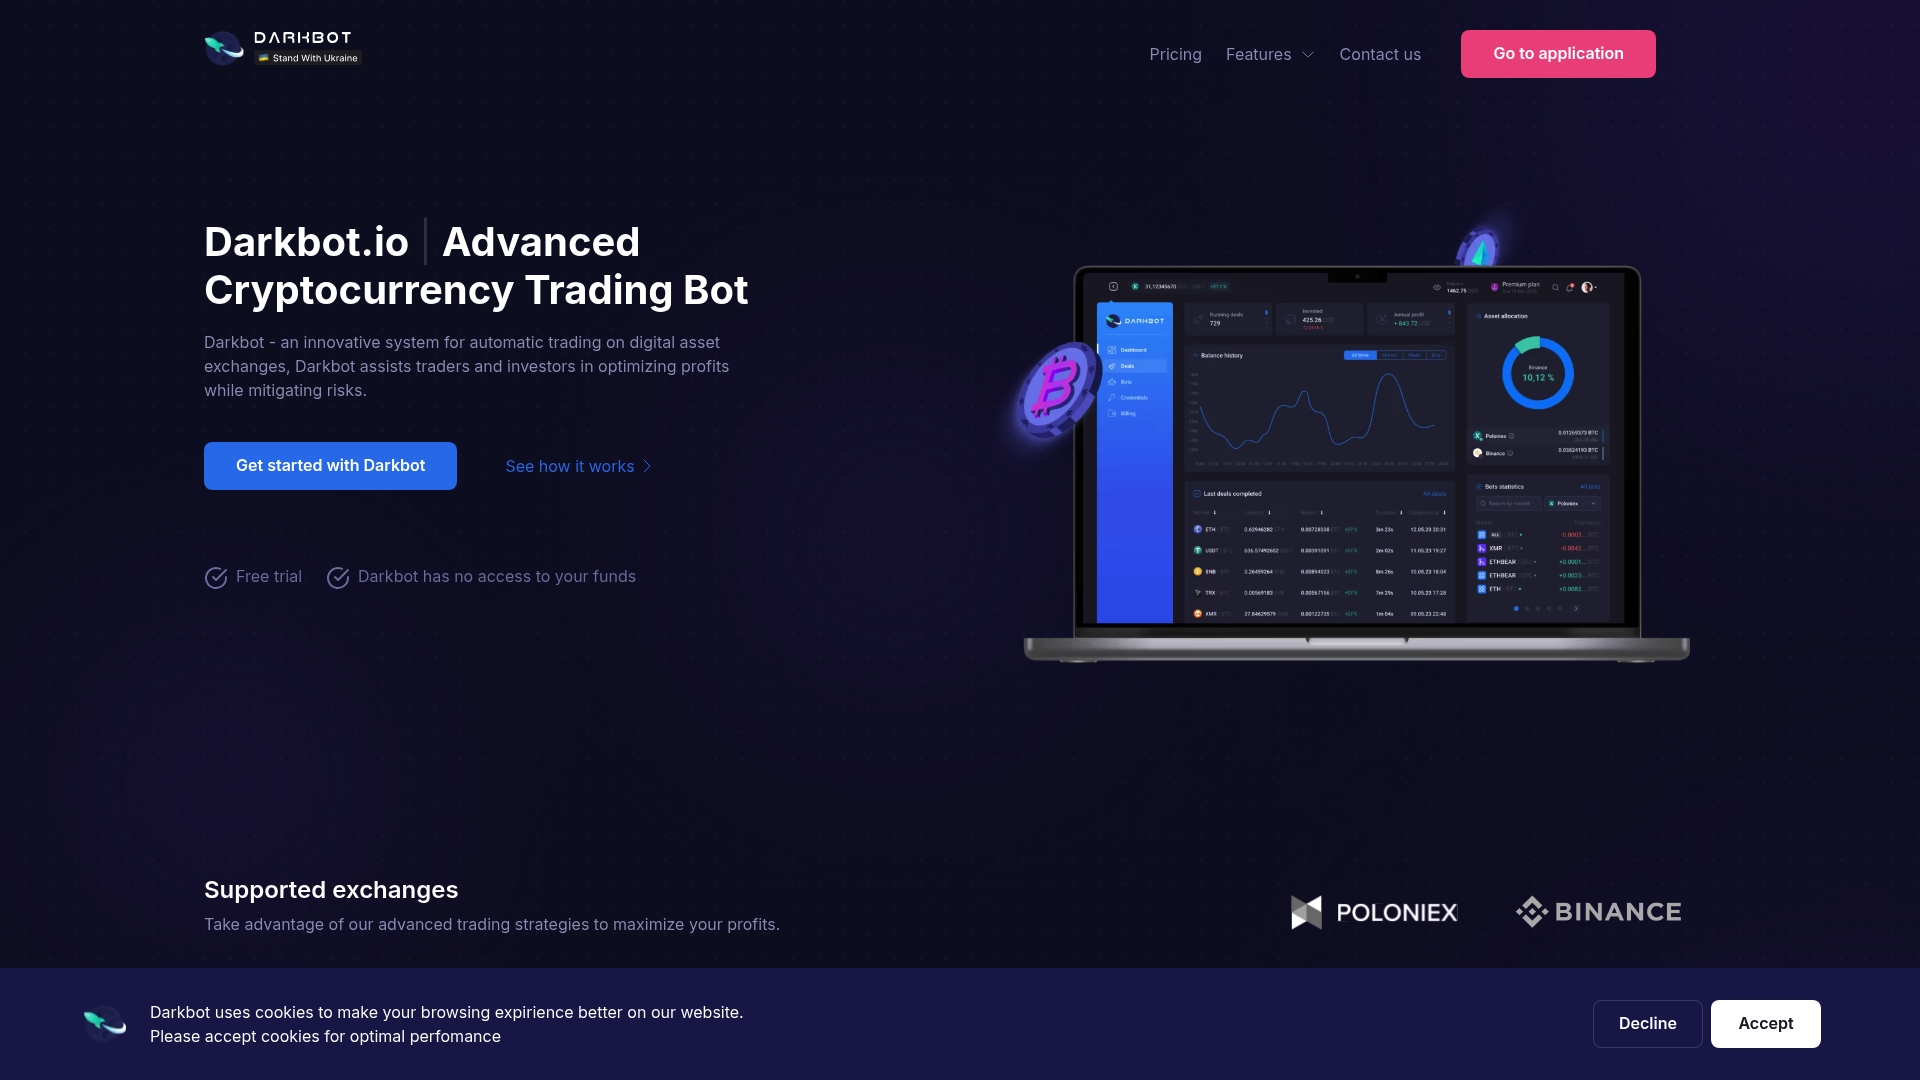
The platform covers the full workflow: historical data caching, OMS simulation with configurable fee and slippage models, paper trading with exchange API parity on Binance, Coinbase, Kraken, and other major venues, and live deployment with automated risk controls. Position sizing templates, automated rebalancing, and real-time analytics are included across subscription tiers. API keys are handled with trade-only permissions by default, and built-in kill-switch logic and drawdown stops are configurable before any capital is committed.
For traders who want to test the backtest and paper-trading workflow before committing to a paid plan, Darkbot offers a free entry tier. Start the full cycle at Darkbot and run your first paper-trading session before scaling to live.
Sources
- How to Backtest a Crypto Strategy in 2026: Tools, Data, Fees and Real Examples - Coin Bureau
- How to Backtest a Crypto Trading Strategy Using Python | Echo Zero Blog
- LevRoz630/crypto-backtester
- Tulipindicators
- Python
This article is general information, not a substitute for advice from a qualified financial advisor. Consult a qualified financial professional about your own circumstances before acting on anything here.
Recommended

Start trading on Darkbot with ease
Come and explore our crypto trading platform by connecting your free account!
Free plan available • No credit card required