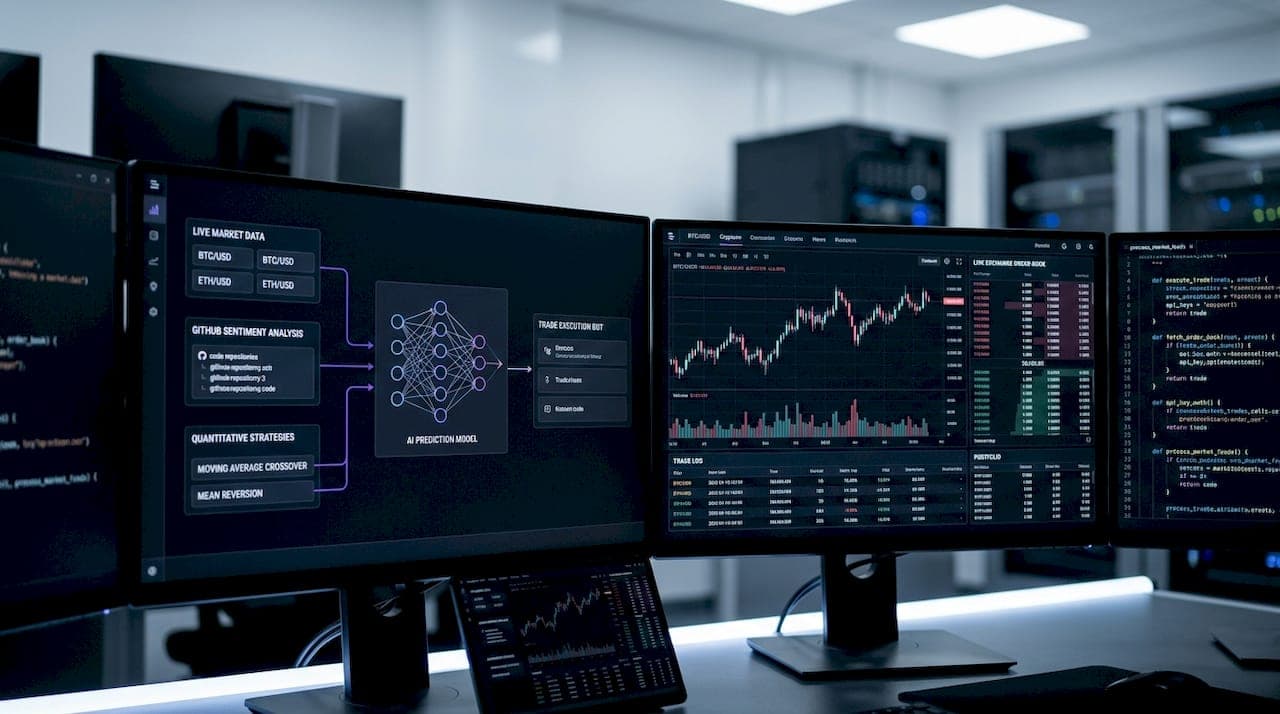
Optimizing trading with analytics: a crypto trader's guide

TL;DR:
- Most successful crypto trading relies on structured analytics, validation, and continuous performance monitoring. Implementing rigorous data preparation, robustness testing, and risk controls ensures strategies remain effective across different market regimes and conditions. Discipline in analytics and automation tools prevents overfitting, maintains consistency, and sustains long-term profitability.
Most crypto traders have built a strategy that looked brilliant on paper and then watched it bleed in live markets. The gap between a lucky backtest and a genuinely robust system is wider than most realize, and bridging it requires optimizing trading with analytics in a structured, repeatable way. This guide walks you through exactly that: how to prepare your data environment, execute validation correctly, manage execution costs, and verify performance continuously. Whether you run bots across three exchanges or manage a single automated strategy, the frameworks here apply directly.
Key Takeaways
| Point | Details |
|---|---|
| Data segmentation | Reserve a substantial portion of historical data for out-of-sample testing to safeguard against overfitting. |
| Robust validation | Use Monte Carlo simulations and walk-forward analysis to ensure strategy stability across different market regimes. |
| Cost awareness | Include trading fees and funding rate costs in your modeling to optimize execution and reduce expenses. |
| Execution discipline | Favor limit orders and monitor liquidity conditions to improve fill quality and minimize slippage. |
| Continuous monitoring | Track live performance against backtests and apply rules to adapt or pause strategies as needed. |
Preparing to optimize trading strategies with analytics
Before you run a single optimization pass, the quality of your input data decides everything. Low-resolution or incomplete historical price data introduces noise that gets mistaken for signal, producing strategies that work only in the data they were trained on. The fix is straightforward but non-negotiable: use tick-level or minute-bar OHLCV data with verified timestamps, and reserve 30% of historical data for out-of-sample testing to validate strategy robustness. That held-out block is your reality check.
Your financial analytics tools need to do more than just plot equity curves. Look for software that generates large candidate strategy sets, filters them against robustness criteria automatically, and supports walk-forward and Monte Carlo testing natively. Without these capabilities baked in, you end up doing manual cherry-picking, which is how overfitted strategies make it to live deployment.
Friction costs are the most underestimated variable in crypto strategy preparation. High-frequency crypto derivatives traders pay significant friction costs annually, primarily from funding rate drag. If you are not modeling these costs before optimization, your simulated returns are fiction.
Key preparation checklist:
- Source clean OHLCV data going back at least three years across multiple market regimes
- Designate in-sample, validation, and out-of-sample periods before any optimization begins
- Collect exchange-specific maker and taker fee schedules for every venue you plan to trade
- Pull historical funding rate data for any perpetual contracts in your strategy universe
- Confirm your software supports automated robustness testing, not just backtest reporting
| Preparation element | Why it matters | Common mistake |
|---|---|---|
| Clean historical data | Eliminates spurious signals | Using aggregated daily bars only |
| Out-of-sample period | Validates generalization | Optimizing across the full dataset |
| Fee and spread modeling | Reflects real net returns | Ignoring maker vs. taker distinctions |
| Funding rate history | Captures carry costs | Treating perpetuals like spot |
| Robustness test suite | Reduces overfitting risk | Relying on a single backtest pass |
Pro Tip: Set your out-of-sample period to cover at least one major volatility event (such as a market crash or a prolonged sideways grind) so your strategy gets tested on conditions it has never seen. A strategy that survives only bull markets is not validated, it is just fortunate.
Applying trading strategy optimization principles from the start saves you from rebuilding an entire workflow after a costly live trading failure.
Executing robust strategy optimization and validation
With your data and tools ready, the actual optimization process follows a specific sequence. Skipping steps here is how curve-fitted strategies survive long enough to do real damage to your account.
Step-by-step optimization workflow:
- Generate a broad candidate set by running your strategy logic across your full in-sample data with varied parameter combinations. Aim for hundreds of candidates, not dozens.
- Apply your initial filters: minimum trade count, minimum win rate, and required profit factor threshold to remove statistically weak results.
- Run walk-forward testing across rolling windows to verify that performance holds across different time periods, not just the best-fit window.
- Apply Monte Carlo simulations and noise-adjusted data series to distinguish skill from luck and evaluate realistic drawdown distributions.
- Check that surviving candidates achieve a Sharpe ratio above 1.0 and Profit Factor above 1.75 in backtests with walk-forward analysis before any live consideration.
- Test the top candidates on your held-out out-of-sample data. If performance degrades sharply, the strategy is overfit and goes back to the drawing board.
Validation metrics worth tracking:
- Sharpe ratio: Measures risk-adjusted return. Below 1.0 signals insufficient reward per unit of risk.
- Profit Factor: Gross profits divided by gross losses. Below 1.75 leaves too little margin for real-world friction.
- Maximum drawdown: The largest peak-to-trough decline. Sets realistic expectations for live pain points.
- Percent profitable months: Tells you whether consistent performance or occasional lucky months drove the equity curve.
- Walk-forward efficiency: The ratio of out-of-sample to in-sample performance. Anything below 0.5 is a red flag.
| Metric | Target threshold | What it tells you |
|---|---|---|
| Sharpe ratio | > 1.0 | Risk-adjusted performance quality |
| Profit Factor | > 1.75 | Cushion against live friction costs |
| Max drawdown | < 20% | Survivability in adverse regimes |
| Profitable months | > 60% | Performance consistency |
| Walk-forward efficiency | > 0.5 | Overfitting resistance |
Risk rules are not optional. Before any strategy touches live capital, define your drawdown limit (the point where the bot pauses automatically), a stop-loss per trade, and a kill switch that halts all activity if account equity drops beyond a pre-set threshold. These are not defensive measures for weak strategies. They are standard components of any AI trading strategy optimization process that takes execution seriously.
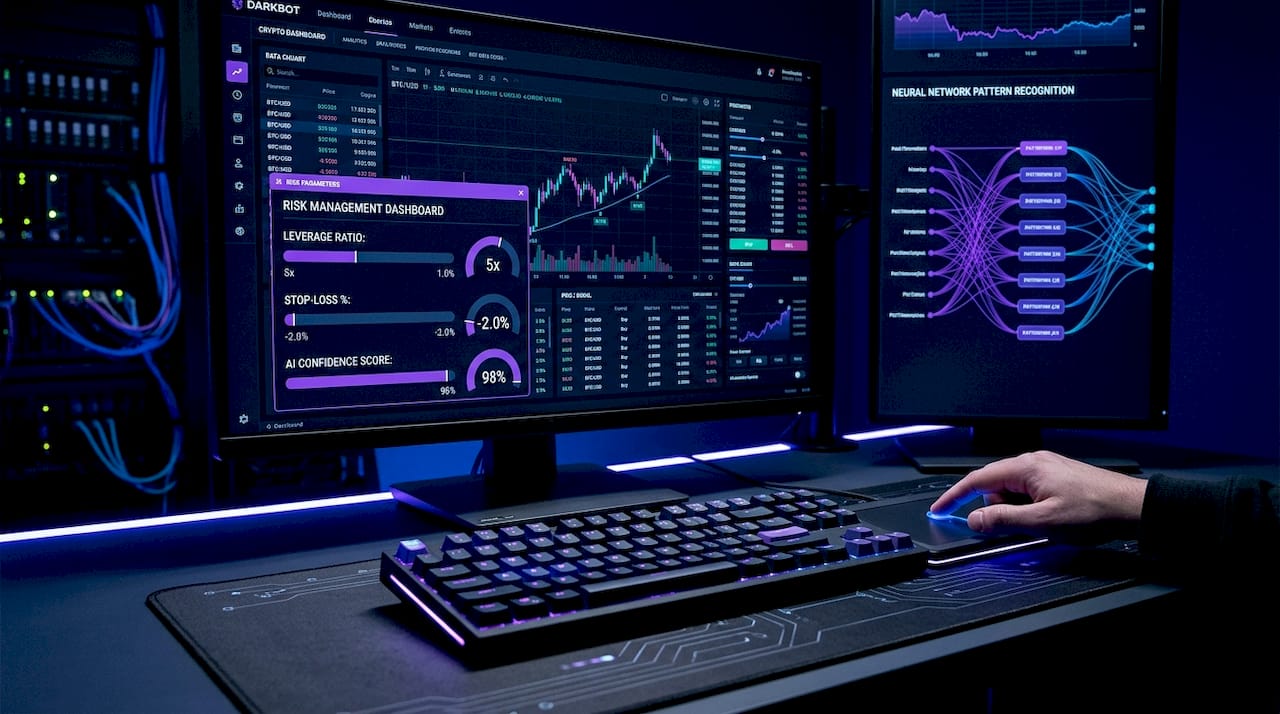
Pro Tip: Test your strategy with randomly shuffled entry signals using Monte Carlo permutation. If the permuted version performs nearly as well as the original, your signal has no real edge. This single test eliminates a large proportion of backtest mirages before they waste your capital.
For a focused look at how these validation steps apply to automation, the guide on crypto trading strategy optimization breaks down the process for automated deployment specifically.
Applying analytics for execution quality and cost management
Even a well-validated strategy underperforms if execution is sloppy. Analytics for trading success must extend beyond the backtest into the live trading environment, where slippage, fill rates, and fee structures erode returns in ways that no backtest fully captures.
Transaction cost analysis evolves into decision support to spot execution patterns and adapt trading behavior. In practice, this means tracking the difference between the price your strategy targeted and the price you actually received, then using that data to adjust order types and timing.
The most expensive execution mistake is treating all exchanges as interchangeable. Fee structures, liquidity depth, and funding rates vary enormously across venues. A strategy that produces 18% annualized returns on one exchange can break even on another after accounting for these differences.
Execution quality checklist:
- Track slippage per trade by comparing intended entry price to actual fill price
- Use limit orders as your default to capture maker rebates and avoid taker premiums
- Monitor bid-ask spreads around your typical entry times; widening spreads are a signal to delay or skip entries
- Review VWAP (volume-weighted average price) deviations to assess whether your order sizing is moving the market against you
- Log and analyze fill rate percentages; consistently unfilled limit orders indicate your price targets are too conservative
Funding rate drag frequently exceeds trading fees and is the largest annual cost for leveraged crypto perpetual trading. When funding rates spike above 0.1% per 8-hour period (roughly 109% annualized), holding a leveraged long position is not a trading decision, it is a carry trade with consistently negative expected value. Build a funding rate monitor into your analytics dashboard and set automatic position size reductions when rates exceed your cost threshold.
Delta-neutral setups, where you hold offsetting long and short positions to collect positive funding income without directional risk, represent one of the more underused applications of real-time analytics in crypto. The data-driven trading strategies that consistently outperform over multi-year periods often include a funding harvesting component that most retail traders never consider.
Pro Tip: Set up a weekly execution audit using your analytics dashboard. Compare your average actual fill price against the strategy’s intended price across the last 50 trades. If slippage consistently exceeds 0.15%, recalibrate your order timing or reduce position size to stay within the friction budget your backtest assumed.
Deeper frameworks for managing these variables appear in the guide on automated crypto trading.
Verifying and adapting trading performance with ongoing analytics
Live trading is where many automated strategies quietly fail. Not dramatically, just gradually, through regime changes, execution drift, and slowly degrading edge. Continuous performance verification using trading insights through analytics is what separates traders who catch these problems early from those who discover them at a significant loss.
Ongoing verification workflow:
- Log every fill with associated market context: volatility level, volume, time of day, and funding rate at entry.
- Compare rolling live performance distributions against the backtest distribution. A live Sharpe ratio that falls 40% below backtest levels within 60 trading days is a warning signal, not noise.
- Track Return/Drawdown ratio and profit factor on a rolling 30-day basis. Declining trends before hitting hard drawdown limits allow earlier, less costly intervention.
- Apply statistical control charts (such as CUSUM or EWMA methods) to detect when your equity curve has shifted into a statistically different regime.
- Schedule a formal strategy review every 60 to 90 days regardless of performance, not just when something goes wrong.
Monitoring checkpoints to build into your process:
- Daily: fill quality, slippage review, funding cost accrual
- Weekly: rolling profit factor, win rate, equity curve shape
- Monthly: regime check, drawdown analysis, strategy correlation review
- Quarterly: full reoptimization pass on expanded data, parameter sanity check
Most discretionary crypto traders lose money in their first year, while systematic backtested strategies can outperform by applying disciplined validation. The differentiator is not predictive ability. It is process consistency.
Backtest Sharpe ratio often poorly correlates with live results, which is why metrics like Deflated Sharpe Ratio (DSR) and Combinatorial Purged Cross-Validation (CPCV) provide more reliable live performance forecasts than standard in-sample metrics.
The key principle for adaptation: adjust position sizing and exposure based on volatility regime shifts before touching core strategy logic. Frequent parameter tweaking in response to short losing streaks is how a validated strategy gets destroyed. Reserve full reoptimization for scheduled reviews with meaningful new data, not for emotional reactions to drawdowns.
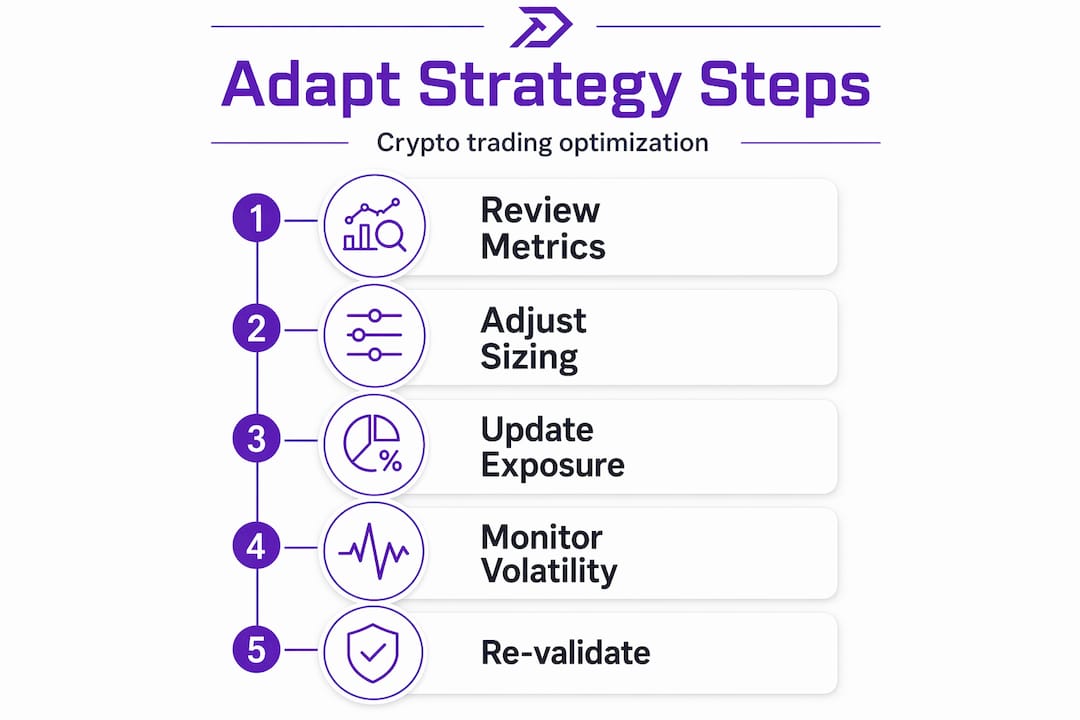
Pro Tip: Build a “strategy health score” composite using three metrics: rolling profit factor, execution slippage trend, and win rate deviation from backtest. If any two of the three move outside acceptable bands simultaneously, trigger a manual review. This prevents single-metric false alarms while catching real deterioration early.
This full verification cycle connects directly to the crypto trading optimization steps that systematic traders apply to maintain performance consistency over time.
Why disciplined analytics, not prediction, powers sustainable crypto trading
Here is the uncomfortable truth that most trading content avoids: analytics and AI cannot tell you where the market is going. The traders who treat financial analytics tools as prediction engines consistently underperform those who treat them as validation and risk management engines.
AI should be viewed as a tool for consistency and probabilistic evaluation rather than future price prediction or profit assurance. This framing matters enormously. When you shift from “what will the market do” to “does this strategy have a repeatable edge under defined conditions,” your entire approach to optimization changes. You stop chasing signals and start building filters.
The practical consequence is that enhancing trading performance requires you to become deeply comfortable with uncertainty. A strategy with a 58% win rate and a 1.9 Profit Factor is not glamorous. It does not predict market direction with any confidence. But deployed with proper risk controls and continuous verification, it compounds capital in ways that directional prediction strategies almost never sustain.
The traders we see fail repeatedly are not the ones with bad strategies. They are the ones with strategies that were never genuinely validated, running without cost models, and missing any systematic review process. Analytics did not fail them. Discipline around analytics did.
The AI trading strategies explained resource illustrates how this probabilistic mindset translates into specific automated strategy designs that prioritize consistency over excitement.
Explore DarkBot’s AI-powered tools for systematic crypto trading optimization
The frameworks in this guide only deliver results when they are supported by tools built for the job. Manual implementation of walk-forward testing, execution monitoring, and regime-based sizing across multiple exchanges is not scalable.
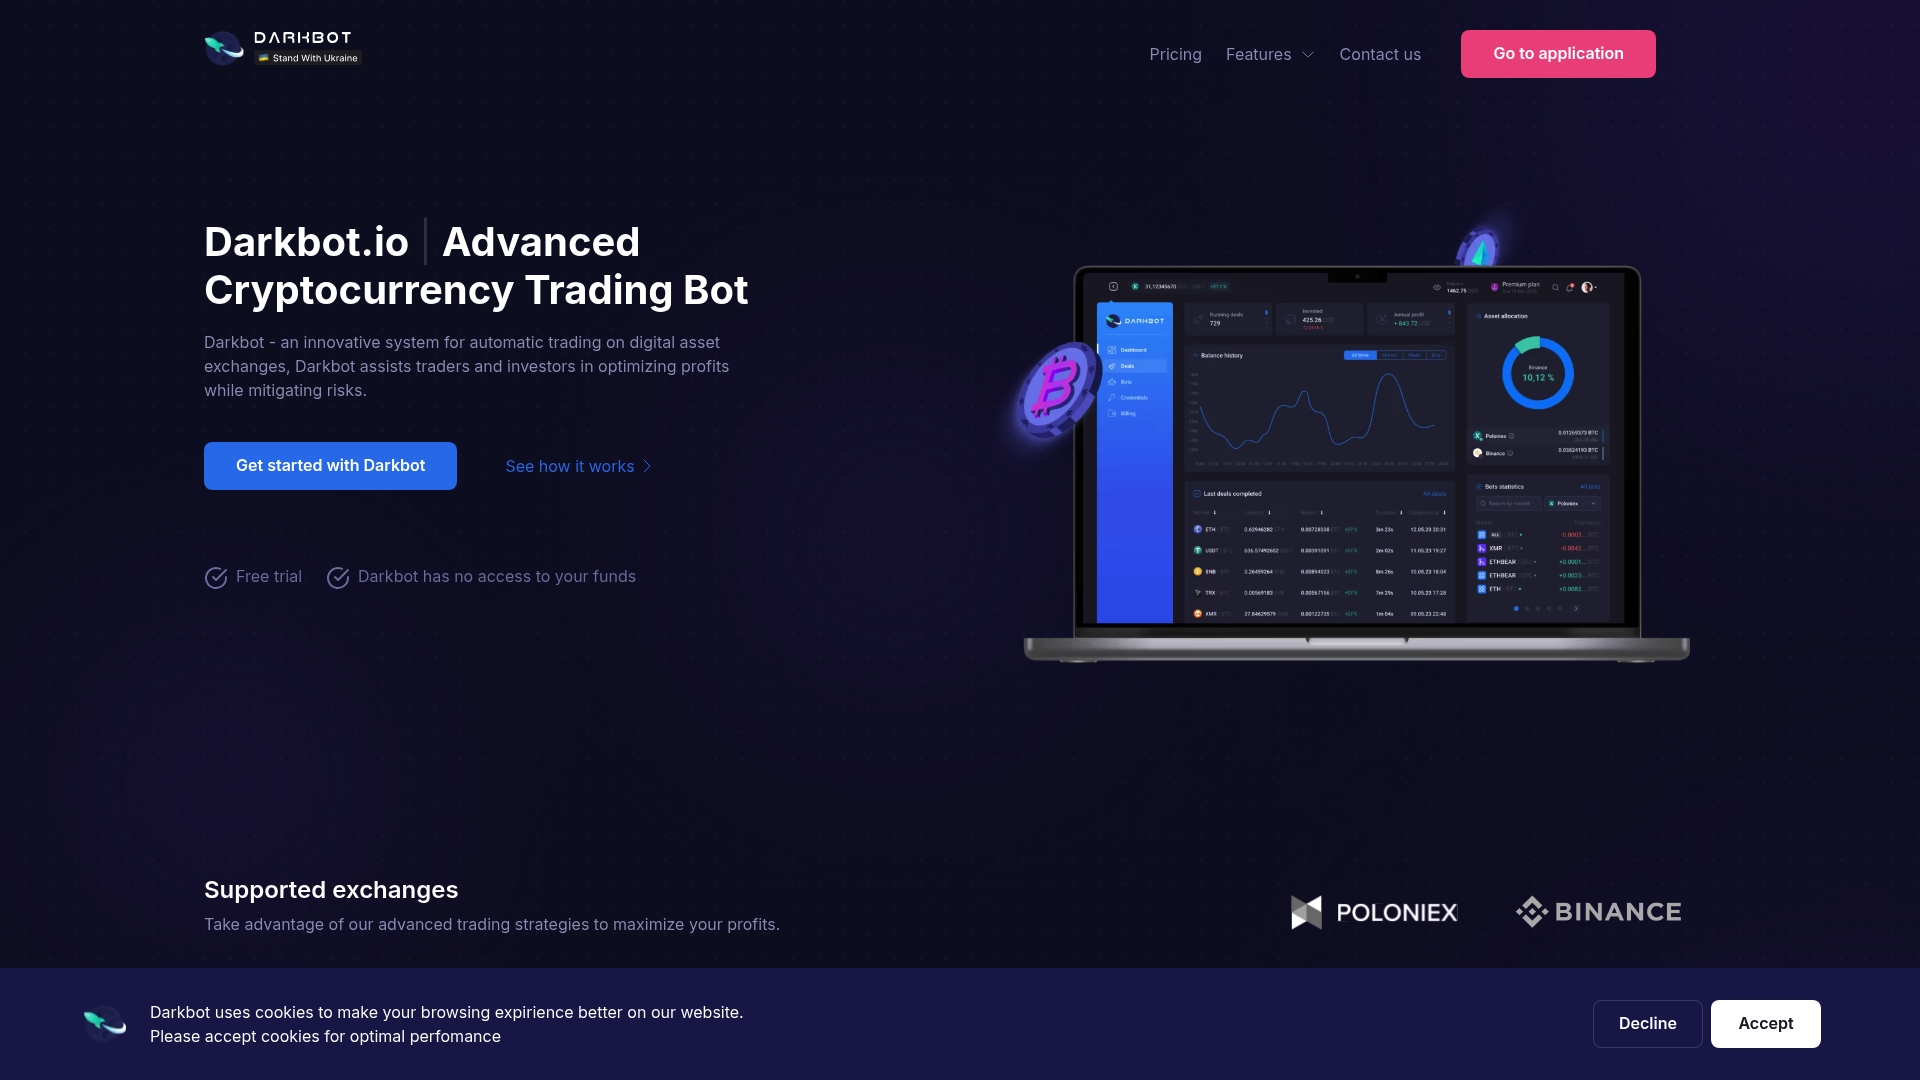
DarkBot’s AI-powered trading bot brings these principles into a single automated platform. You can run backtests, apply robustness filters, manage multi-exchange execution, and monitor performance analytics from one interface. The platform’s portfolio management tools let you manage strategy diversification and automated rebalancing with the same disciplined risk controls this guide covers. Whether you are deploying your first automated strategy or managing multiple concurrent bots across exchanges, DarkBot’s tiered plans give you the infrastructure to do it systematically without rebuilding the wheel.
Frequently asked questions
What is out-of-sample testing and why is it important in crypto trading?
Out-of-sample testing involves reserving a portion of historical data not used during strategy development to confirm the strategy works in unseen market conditions. It is the primary defense against overfitting, where a strategy performs well in training data but fails in live markets.
How do funding rates impact the real cost of leveraged crypto trading?
Funding rates create a recurring payment between long and short perpetual traders, and this drag frequently exceeds trading fees, making it the largest hidden cost for leveraged perpetual positions held over time. Monitoring and modeling funding rates before deploying a strategy is essential for accurate return forecasting.
What validation metrics are recommended for evaluating trading strategies?
Sharpe ratio above 1.0 and Profit Factor above 1.75 are the baseline thresholds recommended for live consideration, alongside walk-forward testing to verify that performance holds across different market regimes and not just the in-sample optimization window.
How can traders reduce execution costs when using analytics?
Using limit orders exclusively and selecting exchanges with lower maker fees substantially reduces trading friction, while analytics dashboards tracking slippage and fill rates allow ongoing cost monitoring and order timing adjustments.
Why is continuous performance verification necessary in automated crypto trading?
Markets evolve, and systematic backtested strategies outperform only when disciplined validation continues after deployment. Without ongoing verification, execution drift and regime changes erode a strategy’s edge before the damage becomes visible in the account balance.
Recommended

Start trading on Darkbot with ease
Come and explore our crypto trading platform by connecting your free account!
Free plan available • No credit card required